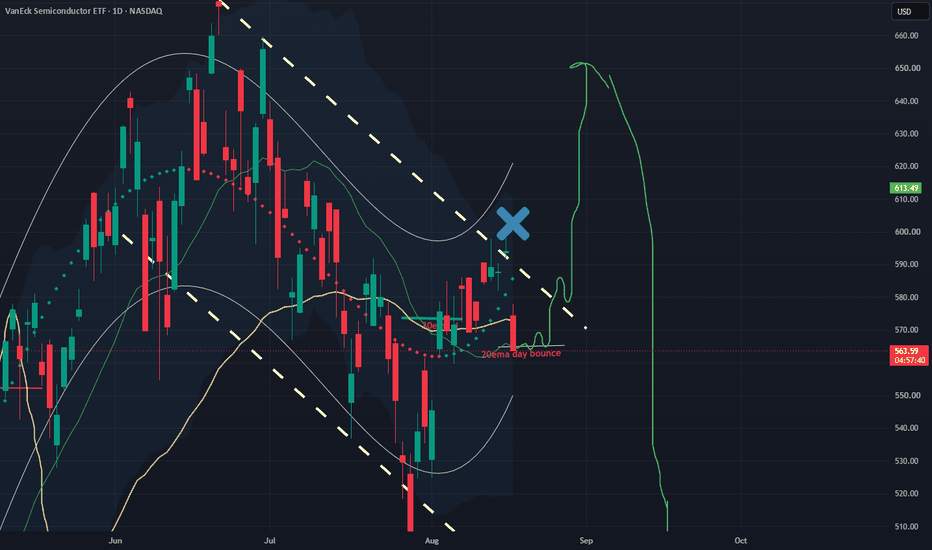
You're too bored to be profitableYou think you need a better strategy.
You don't.
Somewhere in your trading career, you have a strategy you shelved a few months back. There's a system that already works. You backtested it. It held up. Maybe it wasn't glamorous, just 10% more than what the S&P 500 gives a year. It's not the account-flipping holy grail you wanted.
"I just need to find the one that actually works," you tell yourself, opening another YouTube strategy breakdown.
You didn't need a better system. You needed to sit still long enough to run the one you had.
The live market lies
Backtesting and live trading are not the same skill.
Backtesting is fast. You scroll, you tag, you move on. Live trading is slow. It makes you wait for the exact price action your system needs before you're allowed to trade.
That waiting is boring. Especially now, when everything else in your life moves instantly. A notification, a scroll, a like. Then you sit in front of a chart for an hour waiting for one candle to close.
Bored traders break rules
A trader who's bored doesn't sit still. They force a trade that doesn't fit the plan.
They lie to themselves first. "The context is a bit iffy, but this entry kind of fits." It doesn't. You know it doesn't. You take it anyway, because waiting for the real setup felt worse than being wrong.
Here's what that costs you.
Every trade that doesn't match your backtested rules decrease your expectancy and profit factor. Stacked over a course of a few months, they're the difference between the equity curve you tested and the one you're actually trading.
You end up in a drawdown and conclude the system doesn't work. The system was never the problem. The trades outside the system were.
One trade at a time
Don't procrastinate once you have a profitable trading system. Use it.
Take one trade at a time, exactly as your rules say, nothing added and nothing skipped. That's it. That's the whole fix.
Every rule-following trade builds reps. Reps build confidence. Confidence is what lets you sit through the boring stretch instead of forcing something to fill it.
Build the arsenal
Once your first system is running, you've bought yourself something valuable. Time. Now you have the capacity to backtest a second system.
A second system waits for a different setup than your first. Different price action, different conditions, different timing. Run two or three clean systems side by side and there's almost always something legitimate to execute, instead of a boring stretch that tempts you into a trade that isn't yours to take.
That's not chasing a holy grail. That's the actual fix for the boredom that was never going to leave on its own.
Pull your last 10 trades. Count how many matched your backtested rules exactly, entry, stop, and target. If it's under 7, you don't have a strategy problem. You have a boredom problem, and now you know what to do about it.  Long
Long
 Short
Short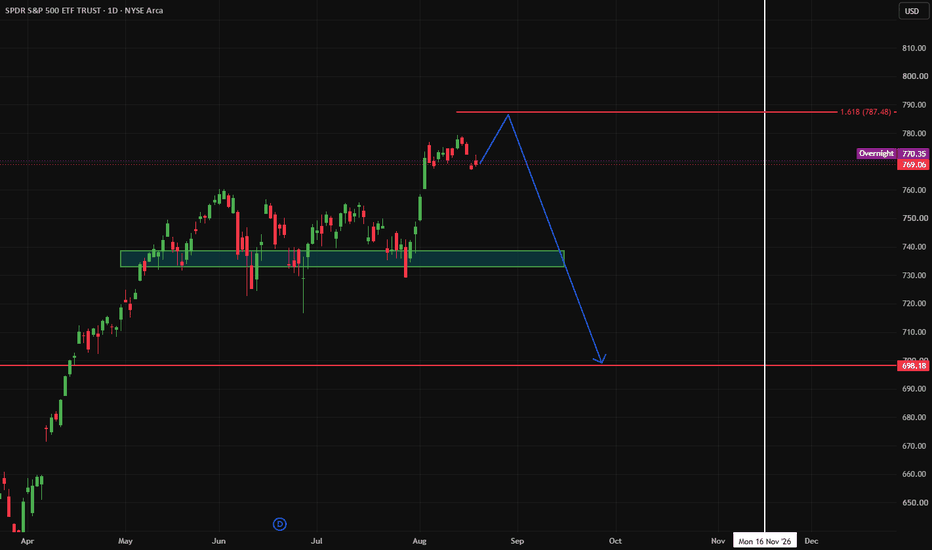
Overview: A Reversal Strategy for Trading on the Daily Timeframe
🍀Overview
● Hi all, I recently completed a Pine Script strategy designed for trading on the daily timeframe.
● I'm not good at technical analysis, so I rely on setups rather than discretionary analysis. I put the rules together into a strategy so the decisions are more systematic.
● The strategy has a few parameters that can be adjusted. I have now finalized them, and the rules will remain unchanged unless a change is necessary.
● Since I only completed the strategy recently, it has already entered positions in some tickers.
● For the initial posts on each ticker, I will describe the setup retrospectively and then continue to follow the trade until the strategy or I exit the position.
● For new setups, I will publish a separate idea as soon as the strategy enters a position and follow the trade until it closes.
● Let's go through the strategy using SPY as an example.
🍀Strategy
Strategy name
● Currently using the generic name "Reversal Strategy"
Script
● Reversal Strategy
Direction
● Long only
Assumption
● This is a long-only strategy. The underlying assumption is that these instruments are likely to grow over time.
● The strategy tries to take advantage of price fluctuations by entering a long position when the stock is at a discount.
● If this assumption does not hold, I don't expect the strategy to work well. That's why I focus on instruments such as SPY and the Mag 7, with others potentially added in the future.
Instruments
● SPY, Mag 7
Timeframe
● Daily
Indicators
● RSI (Relative Strength Index)
○ This is built on top of TradingView's original RSI indicator. It preserves the original RSI calculation and visualization while adding customizable overbought/oversold exit signals directly on the main price chart.
● NATR Oscillator
○ The NATR Oscillator converts Normalized Average True Range into a rolling 0–100 oscillator.
○ NATR is calculated as ATR divided by the current closing price and expressed as a percentage. The indicator then compares the current NATR with the highest and lowest NATR readings over the selected lookback period.
Signals
● Main signal: RSI
○ Long setup: RSI crosses above 30
○ Short setup: RSI crosses below 70
● Confirmatory signal: NATR Oscillator
○ NATR Oscillator >= 80
Scoring
● Main signal: 0.5
● Confirmatory signal: 0.5
● Setup score: Main signal score + confirmatory signal score
● Entry threshold: 1.0
Conditions
● A setup occurs when both signals appear at the same time.
● The strategy must not currently be in a position.
● The strategy enters when the setup score is greater than or equal to the entry threshold.
● One entry, one exit. No scaling in or out.
Risk Management
● Reward-to-risk ratio: 4:1
● Entry: Close of the candle that triggers the setup
● Stop loss: 4x daily ATR
● Take profit: 16x daily ATR
● Manual exit: If an opposite signal or short setup appears, I can choose to exit only when the reward is at least 2R. Otherwise, I will continue holding.
● Order management: Bracket order (limit entry, market stop, limit target)
● Rule: If the entry is not filled and price reaches the target first, the bracket order is canceled. The strategy treats this as a missed setup and waits for the next one.
Visualization
Please refer to the 2nd screen shot.
● Pane 1: Price Chart
○ Shapes
■ Green triangles: RSI crosses above 30
■ Red triangles: RSI crosses below 70
○ Bracket order visualization (a simplified version compared with TradingView's long/short position drawing tools)
■ Green zone: profit zone
■ Red zone: loss zone
■ Middle gray line: entry price
○ Labels
■ Entry label: entry price
■ Stop label: stop price and stop distance
■ Target label: target price and target distance
● Pane 2: Volume Z-Score
○ Shown for completeness and does not affect the strategy.
○ It compares the current volume with its recent average and standard deviation to identify unusually high, normal, or below-normal volume.
● Pane 3: RSI
○ Chart for the RSI indicator.
● Pane 4: NATR Oscillator
○ Chart for the NATR Oscillator.
● Pane 5: Strategy pane
○ Static lines
■ Green line: long setup threshold, currently 1.0
■ Red line: short setup threshold, currently 1.0
○ Dynamic lines
■ Green line: long setup score for that candle
■ Red line: short setup score for that candle
○ Peaks
■ Green peak: a long setup occurs when it touches or crosses the long threshold
■ Red peak: a short setup occurs when it touches or crosses the short threshold
○ Table
■ Ticker
■ Bias: long setup score > short setup score = long bias; reverse = short bias; otherwise tie
■ L/S scores (thres): long/short scores and thresholds on the latest candle
■ Stop/target dist: stop and target distances if entering a position, currently 4x daily ATR for the stop and 16x daily ATR for the target
Alerts
● The strategy fires an alert whenever a setup occurs, long or short, regardless of whether it is currently holding a position.
🍀Example: SPY
As mentioned earlier, I only completed the strategy recently, so I can only analyze this trade retrospectively. Let's look at what the strategy would have done.
● Date: 09/04/2025
● Signals
○ Main signal: RSI oversold exit — RSI crossed above 30
○ Confirmatory signal: NATR Oscillator >= 80
● Scoring
○ Long setup score = main signal + confirmatory signal = 0.5 + 0.5 = 1.0
○ The long setup score was greater than or equal to the long threshold, resulting in a green peak in Pane 5. The strategy then entered a long position by placing a bracket order.
● Risk Management
○ Reward-to-risk ratio: 4:1, although I can exit earlier
○ Entry: 548.62, the close of the setup candle
○ Stop loss: 4x daily ATR, with a stop distance of 75.54
○ Take profit: 16x daily ATR, with a target distance of 302.17
● Order Management
The strategy would place a bracket order
○ Limit entry: 548.62
○ Market stop: 484.37
○ Limit target: 805.63
● Trade Status
○ Target: Not reached
○ Opposite signal: No short setup has appeared since entry.
○ Exit condition: None met, so the position remains open.
That's it for an overview of the strategy and an example using SPY.
Short 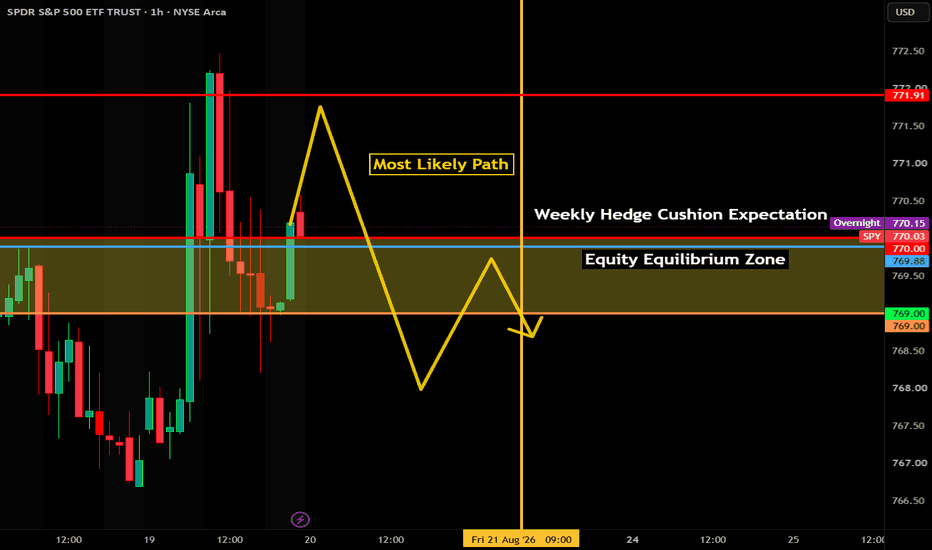
SPY: old value above, new value below, nothing traded in betweenSPY, 1 hour. Weekly volume profile plus weekly-anchored pivots.
Where the auction has been. The last two completed weeks built value in nearly the same place: the Aug 3-7 profile's point of control sits at roughly 771.9, the Aug 10-14 profile's at roughly 772.8. That was the market's accepted price for two weeks.
Where it is now. This week opened near the top of that range and has spent three sessions building a new high-volume node well below it. The developing weekly point of control is roughly 767.85, with the bulk of the week's volume between roughly 767.5 and 769.9. Wednesday closed 769.06, inside that node.
What has not traded. Roughly 770.0 to 772.5 is the thinnest part of this week's profile, and it is exactly where both prior weekly points of control sit. Weekly S1 (771.09) runs through the middle of it. Old value above, new value below, and very little trade in between.
What the weekly pivots add. PP (774.97) was tested once and held, then BC (774.29), TC (775.66) and S1 (771.09) were each tested once and broken. Price has been below S1 for five bars and has already reached S2 (768.68), tagging it three times. R1 (778.85) has not been tested at all this week.
What to look for Thursday.
Balance case: rotation inside roughly 767.5 to 769.9. That is the node the market is actively building, and trade inside it is balance, not direction.
Upside: a reclaim of the overnight level near 770.1 and then S1 at 771.09 puts price into the thin pocket. There is very little volume on the profile between roughly 772.5 and the old value at roughly 772.8 up to BC at 774.29, so that stretch is unobstructed.
Downside: losing S2 at 768.68 and then the node's low near 766.8 leaves nothing on the profile until S3 at 764.80. That gap is as thin as the one above.
What changes the read: acceptance back above BC at 774.29 would put the auction inside the old value area again and make this week's move a failed probe lower rather than a migration of value.
Charted with our own weekly volume profile (PVP) and pivot (PSB) studies. We build tools to help traders make better decisions. See the auction more clearly. Independent author, not affiliated with TradingView.
www.tradingview.com  Short
Short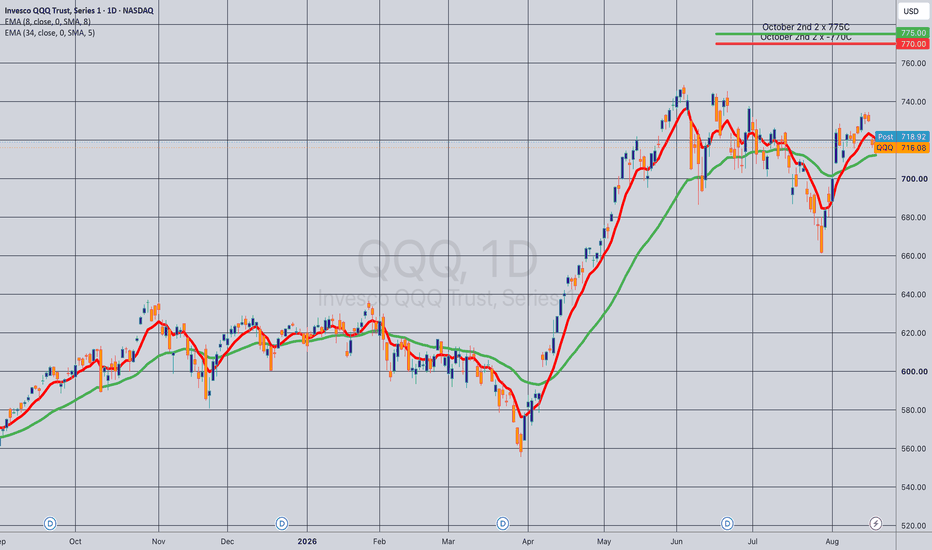
The NAS100 Recession Signal You Can't Afford to IgnoreEvery NAS100 Trader Knows This Recession Signal—But Most Trade It Wrong
This isn't another indicator. This is a structural shift in the index's behavior.
We're seeing a breakdown in the trend structure that has historically preceded significant drawdowns in the Nasdaq 100. The question is no longer if the signal is forming, but how traders are positioning for it.
What the data is telling us:
Positioning has already turned. Net short exposure in Nasdaq 100 futures among large speculators is at its most bearish level since the pandemic, and this positioning topped out months before the index did. This is a classic case of smart money leading price.
The "Death Cross" is a symptom, not the cause. While the 50-day moving average crossing below the 200-day moving average is a significant technical event, it's the macro-economic signals behind it that truly matter.
Recession signals are not just for macro-economists. Whether it's the Sahm Rule, yield curve dynamics, or GDP slowdown, these forces directly impact the NAS100's tech-heavy components.
The Setups We're Watching
In the analysis below, I've marked key areas of interest using a price action and market structure framework. The focus is on liquidity levels and structural breaks that could confirm a larger move.
Key Takeaway for Your Trading
Structure comes first. A recession signal is a warning, not a guaranteed outcome. Your risk management and trading plan will determine your success. As the data shows, the index can recover quickly once forced-selling exhausts.
Trade Safe. Short

SPY Thursday/Friday Deep DiveThe Market Has Moved a Lot — But It Hasn’t Actually Gone Anywhere Yet
Structurally, SPY is still sitting in an important battlefield.
We’ve had a sharp selloff, a Treasury-driven rally, hawkish Fed minutes, major individual-stock moves, and continued sector rotation.
And after all of that, SPY is still sitting almost directly around the same 769 decision area.
That matters.
The market has received meaningful information this week and still has not established clear acceptance outside the current structure.
🟢 Green — genuine repair
For me this needs to happen sequentially.
769 holds → 772 reclaimed → 773 reclaimed → structure begins building above 773.
Only then do I start taking the larger recovery seriously.
Above 773, the next battlefield becomes:
775 → 776 → 778/779
Merely touching 772 or 773 is not enough.
We’ve already seen SPY reach that area.
Acceptance is what changes the chart.
If Thursday brings constructive economic data, yields remain contained, and SPY begins holding above 773, then Thursday and Friday could be spent repairing a meaningful portion of this week’s damage.
This is a real possibility, but it is not currently my favorite scenario.
🟡 Yellow — negotiation
Continued negotiation between roughly 767 and 773 remains very plausible.
Why?
Because buyers proved today that 767 is defendable.
But sellers also proved that 772–773 is not easily reclaimable.
That creates a natural battlefield.
We could see something like:
767/769 → 771/772 → rejection → 769 → another attempt
repeatedly while the market digests rates, Thursday’s data, Walmart earnings, and then Friday’s PMIs.
The important difference from earlier this week is that I would not expect this negotiation to remain neatly contained.
The structure is thinner and more fractured now.
So Yellow could mean larger probes, sharper reversals, and considerably more volatility while price still technically remains in negotiation.
And after what we’ve watched the last few sessions, I would not underestimate the market’s willingness to sit in this area and piss everybody off. 😂
Importantly, that would not necessarily represent bullish or bearish failure.
It could simply be price building new agreement after a violent move down from 779.
That could ultimately become constructive.
🔴 Red — bearish continuation
This becomes serious if:
769 fails → 767 fails → price cannot reclaim either one.
Again, the important word is:
Acceptance.
A wick through 767 is not enough.
We already learned how dangerous that assumption can be.
If SPY begins closing underneath 767 and subsequent attempts to reclaim the level fail, then the structure below gets considerably thinner.
The next major lower Active AOA reference on this chart is around:
758
I would not call 758 a target.
That is too simplistic.
What it tells us is that there is dramatically less established agreement underneath the current battlefield.
That means a genuine bearish expansion could become much more volatile and move faster than traders expect.
The red path may begin relatively orderly.
If acceptance develops below 767, the lack of structure underneath is what could make the move increasingly disorderly.
My weighting going into Thursday
🔴 Red — 45%
🟡 Yellow — 35%
🟢 Green — 20%
That is an interpretation of current structure and the macro environment, not a statistical forecast.
Red gets the edge because the hourly structure has become increasingly thin beneath the current battlefield, while the upside requires several layers of repair before the bullish case becomes convincing.
Yellow remains very plausible because SPY has demonstrated both:
buyers below
and
sellers above
Until one side actually wins, I see no reason to manufacture conviction.
The simple map
767 = structural floor / bearish trigger if accepted below
769 = current agreement / pivot
772–773 = first meaningful repair zone
775–776 = larger recovery confirmation
778–779 = old upper battlefield
758 = next major lower AOA if current structure truly fails
The asymmetry is worth noticing:
Above current price, structure is layered.
Below current price, structure gets sparse quickly.
That is why the bullish path may ultimately be more orderly, while a true bearish breakdown could become significantly more volatile.
I’m not interested in predicting which path SPY chooses.
I want to know what each path looks like before it happens.
I’m off from trading until Monday.
Sunday evening, we reset the board and map the next week. SOXL possible inverse head shoulders day chartAMEX:SOXL
I don't see SOXL dropping much from here. This could simply be a bear trap.
The key level to watch is the daily 200 EMA around $105. As long as SOXL holds above it, the bullish trend remains intact. However, if it closes below the daily 200 EMA for multiple days and fails to reclaim it, I'd consider that a shift to bearish momentum.
If SOXL can hold above $120, it could be forming the right shoulder of an inverse head-and-shoulders pattern. If that's the case, I could see a move toward $155. If it then breaks above and holds that level, the next target could be around $230, where there's an unfilled daily gap between $230 and $240.
Even if SOXL reaches that area, I highly doubt it continues much higher. I'm still bearish on the monthly chart heading into October, as I believe the market is becoming extremely overbought. A rally to $230 would actually look like a potential shorting opportunity to me.
Looking further ahead, I could see SOXL trading in the $70–40 range sometime in 2027. That scenario only becomes likely if it loses the daily 200 EMA and bearish momentum takes control. As long as it stays above the 200 EMA, I'll remain bullish. Once it loses that level, I'd be looking for short opportunities instead.  Long
Long
Long 
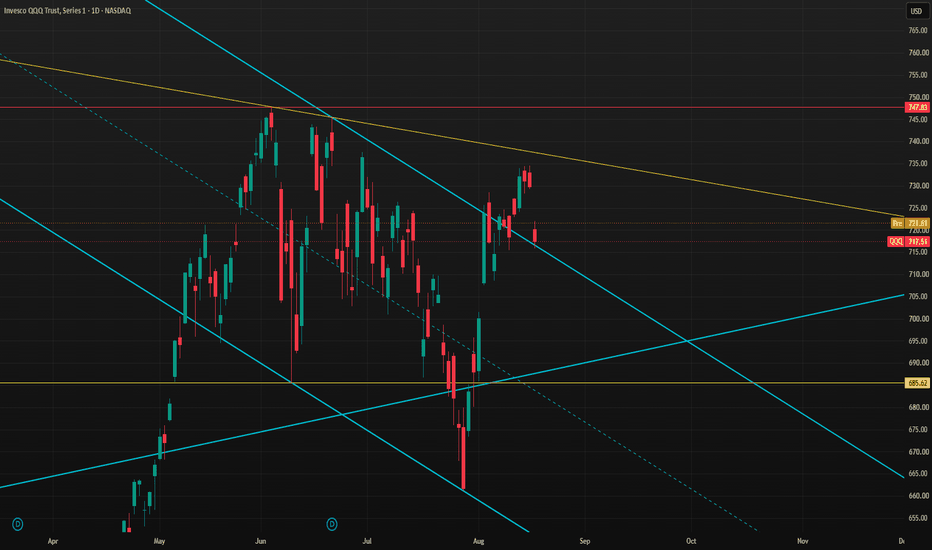
 Long
Long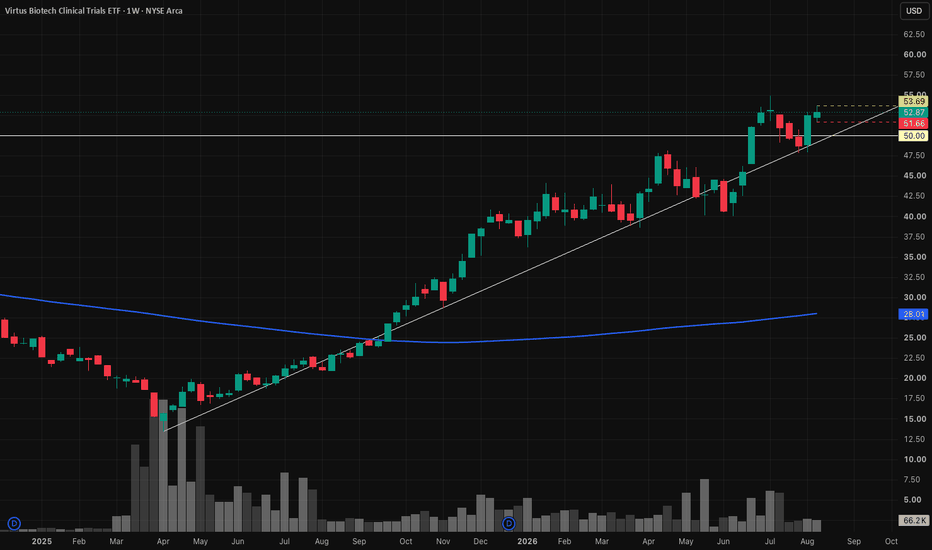
Research 19.08.2026🌏 Markets:
AMEX:SPY +0.39 0.05%(pre/m)
NASDAQ:QQQ -0.96 -0.13%(pre/m)
🆕 Economic News:
10:30 USA – EIA Crude Oil/Gasoline Stocks Change
14:00 USA – FOMC Minutes
📈 Gap Ups
Reaction to earnings/guidance:
NASDAQ:KC NYSE:EL NYSE:YMM NYSE:KEYS NYSE:VIK NYSE:TOL NASDAQ:JKHY NYSE:TJX NYSE:SQM NASDAQ:ADI
Other news:
A customized vaccine from Merck NYSE:MRK and Moderna NASDAQ:MRNA kept patients cancer-free for longer than standard treatments, after their melanoma skin cancers had been cut out. It is the first Phase 3 trial success for a cancer treatment vaccine, meaning the companies can now ask regulators to approve the treatment for marketing. / NASDAQ:BNTX rising in syphaty to MRNA
NASDAQ:SKHY announced a massive KRW 40 trillion (~$28.6B) share buyback and cancellation program and said it will return more than 50% of 2025–2027 free cash flow to shareholders.
📉 Gap Downs
Reaction to earnings/guidance:
NASDAQ:MRCY NYSE:ZTO NYSE:LOW NYSE:TGT NYSE:ZIM
Other news:
NASDAQ:WYFI announced a $250M convertible senior notes offering
NASDAQ:NBIS announces proposed private offering of $4.50 billion of convertible senior notes
UBS on Tuesday lowered NASDAQ:INTC price target to $112 from $121 while keeping a Neutral rating.
U.S. memory chip stocks dipped in overnight trading heading into Wednesday, tracking a sharp selloff in Asian tech stocks and South Korea's benchmark index, where trading was briefly halted after a steep plunge. : NASDAQ:SNDK NASDAQ:MU NASDAQ:WDC NASDAQ:STX
NASDAQ:WYFI Announces Pricing of Upsized $270.0 Million Convertible Senior Notes Offering
‼️ Additional
Trump paused the introduction of 50% tariffs on Canadian goods for three days and announced a “deal” with Ottawa.
-- The rapid rise in diesel prices has started to weigh negatively on the US economy — FT.
Chinese private space company LandSpace successfully launched and landed its reusable ZQ-3 rocket on land. NASDAQ:SPCX
The Senate vote on the CLARITY Act is scheduled for September 15 at 2:00 p.m. ET, Senator Cynthia Lummis said.
Unitree Robotics shares surged 600% in their Shanghai debut.
BofA: Historically, the weak period for US equities begins in August, with selling pressure typically peaking in mid-September.
-- LPL Research: August is one of the weakest months of the year for US equities. September is the weakest.
WSJ: Shareholders are becoming disappointed with OpenAI’s financial performance in its race against Anthropic.
Cerebras NASDAQ:CBRS said its new computer delivers an AI performance speed advantage compared with Nvidia $NVDA.
Amazon NASDAQ:AMZN said it will expand its drone delivery service to nearly 500 US cities this year.
🏢 IPO
NYSE:LYNX – Lyntris, Inc.
Company provides defense technology connectivity solutions for the U.S. Department of Defense and allied militaries. Its products cover sensor architecture, sensor hardware and data software platforms used in missile defense, maritime surveillance, space ISR and communications. Lyntris was formed through the combination of Accelint and Vitesse.
Price: $17.50
Shares: 17.0M
Raised: $297.5M
Market Cap: ~$1.89B
LTM:
Revenue: $450.8M
Net Income: -$11.8M
Key point:
IPO was cut from 24.0M to 17.0M shares and priced at $17.50, below the original $19.00–$22.00 range.
Comparable public companies: NASDAQ:PLTR , NYSE:LHX , NYSE:LDOS , NASDAQ:SAIC , NASDAQ:KTOS , NYSE:BAH
📋 List of tickers involved:
NASDAQ:KC NYSE:EL NYSE:YMM NYSE:KEYS $VOK NYSE:TOL NASDAQ:JKHY NYSE:TJX NYSE:SQM NASDAQ:ADI NYSE:MRK NASDAQ:MRNA NASDAQ:BNTX NASDAQ:SKHY NASDAQ:MRCY NYSE:ZTO NYSE:LOW NYSE:TGT NYSE:ZIM NASDAQ:WYFI NASDAQ:NBIS NASDAQ:INTC NASDAQ:SNDK NASDAQ:MU NASDAQ:WDC NASDAQ:STX NASDAQ:SPCX NASDAQ:CBRS NASDAQ:NVDA NASDAQ:AMZN NYSE:LYNX NASDAQ:PLTR NYSE:LHX NYSE:LDOS NASDAQ:SAIC NASDAQ:KTOS NYSE:BAH
Best regards – hi2morrow team.
 Long
Long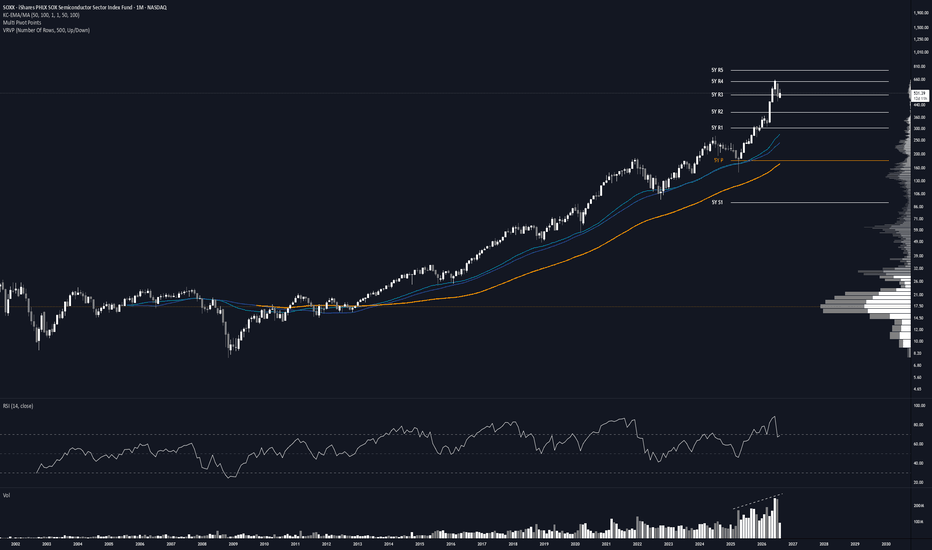
Long 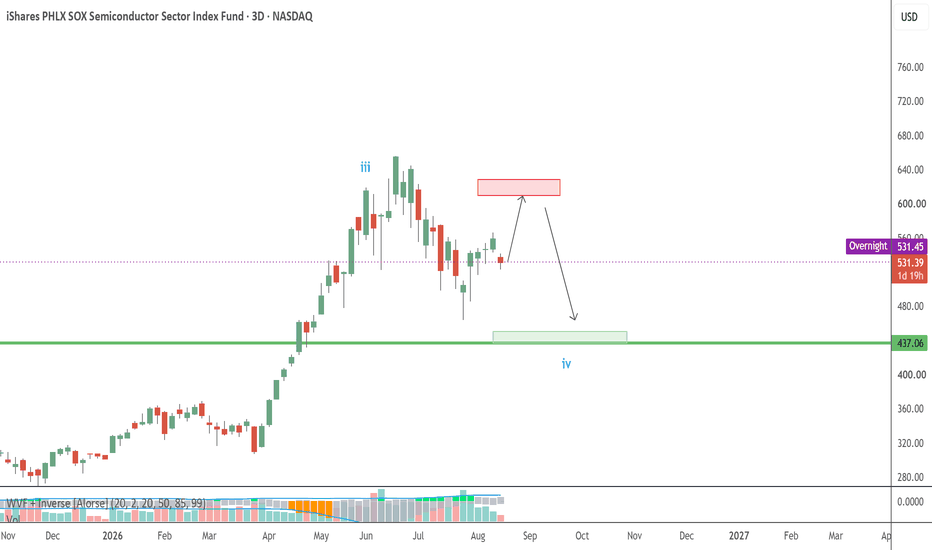
Long 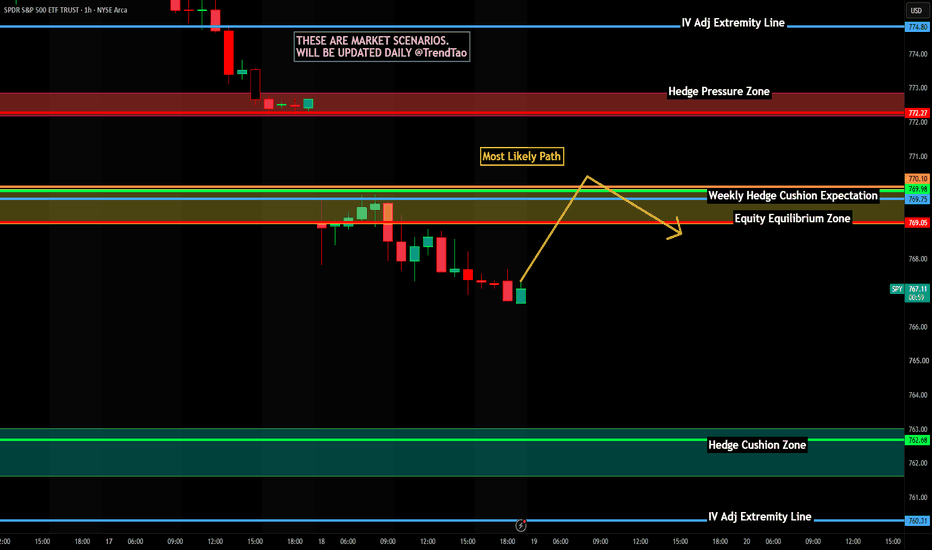
SPY End-of-Day Market Report — Aug. 18Today was not an easy trading session.
SPY finished around 767.37, down roughly 0.74%, but the weakness underneath the surface was considerably greater. QQQ lost about 1.69%, IWM fell 1.26%, while DIA was down only about 0.22%. That dispersion matters: growth and technology were taking much more damage than the Dow.
The macro pressure that created this morning’s gap never really disappeared.
Renewed U.S.–Iran tensions kept oil elevated, with Brent settling around $91.02 and WTI around $84.94. At the same time, long-term Treasury yields remained elevated, with the 30-year yield briefly reaching its highest level since 2007. That combination — higher energy prices, renewed inflation concerns and higher borrowing costs — hit technology particularly hard. Reuters reported the Nasdaq down about 1.3% and semiconductor stocks among the session’s biggest casualties.
What the chart taught us today
SPY spent almost the entire regular session trapped in the same broad ~767.5–769.5 chop box.
There were multiple attempts to break the range.
None produced sustained expansion.
That distinction became important today because the 5-minute chart eventually produced a valid bearish Entry structure, but the 15-minute chart continued to show a market that was overwhelmingly balanced.
That is one of my biggest lessons from today:
A valid lower-timeframe entry does not automatically mean the higher-timeframe environment deserves the trade.
The market finally broke beneath the range during the final minutes of trading, closing around 767.4.
That late breakdown matters.
But I’m not going to treat one late-session move as confirmation that tomorrow must continue lower.
Tomorrow’s battlefield
The first level I care about is essentially where we finished:
~767
That weak hourly reference has now become much more important.
If SPY opens tomorrow and begins accepting beneath 767, today’s late breakdown gains credibility. The hourly chart remains structurally thin underneath this area, so I would respect further downside rather than automatically assuming a bounce.
But if SPY quickly reclaims 767.5–769 and begins accepting back inside today’s range, then today’s final breakdown starts looking more like another failed escape.
From there, the repair sequence remains:
769 → 771 → 772 → 773
And only after that would I start thinking seriously about a larger recovery toward the newer 776 Projected AOA.
The catalyst we cannot ignore
Tomorrow afternoon brings the FOMC minutes from the July 28–29 meeting at 2:00 PM ET.
That meeting was unusually divided, with the Fed holding rates at 3.50%–3.75% while three members favored a 25-basis-point hike. Markets will be looking through the minutes for how concerned policymakers were about inflation and whether additional tightening remains a serious possibility.
That becomes especially relevant after today’s move in oil and long-duration Treasury yields.
Tomorrow morning also brings another important look at the consumer. Target, Lowe’s and TJX all report Wednesday, with Target’s earnings call scheduled for 8:00 AM ET and Lowe’s at 9:00 AM ET.
My expectations for Wednesday
I have a slight bearish lean, but I am absolutely not married to it.
🔴 Bearish continuation
SPY accepts below ~767, attempts to reclaim it fail, and sellers finally produce the expansion that never materialized during today’s range.
That would tell me today’s final breakdown was real.
🟡 Failed breakdown / negotiation
SPY reclaims 767.5–769 and spends another session negotiating around the same battlefield.
Given how aggressively today absorbed multiple breakout attempts, I would not dismiss this possibility at all.
🟢 Repair
SPY reclaims the entire range and begins working through:
769 → 771 → 772/773
That would be the first evidence that buyers are actually repairing structure rather than simply producing an oversold bounce.
One final lesson from today
Yesterday we had a clean setup, waited for confirmation and were paid +50%.
Today we had a valid setup in a much more difficult environment and took the loss.
And because we already follow two very simple rules —
one trade per day
hard -20% stop
—we are still positive on the week.
That is why risk management matters.
You do not need to win every trade.
You need to make sure one losing trade cannot erase the work of the trades that came before it.
Tomorrow starts from zero again.
No revenge trade.
No need to make today’s money back.
No prediction that must be proven correct.
We map the battlefield, wait for structure, and take the trade only if the market earns it. Short 
Long 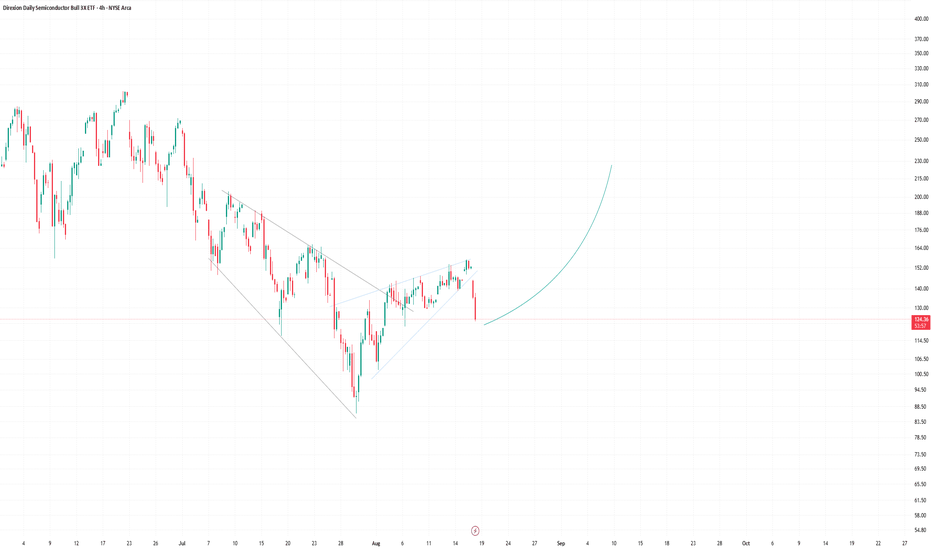
 Long
Long