
ETF market

Research 06.08.2026🌏 Markets:
AMEX:SPY +0.93 0.12%(pre/m)
NASDAQ:QQQ -4.02 -0.56%(pre/m)
🆕 Economic News:
08:30 USA – Initial/Continuing Jobless Claims
08:30 USA – Nonfarm Productivity
08:30 USA – Unit Labour Costs
📈 Gap Ups
Reaction to earnings/guidance:
NASDAQ:SOUN NASDAQ:DASH NASDAQ:CEG NYSE:USFD NYSE:IONQ NYSE:LNG NYSE:HWM NYSE:OXY NYSE:MCK TSX:CNQ NYSE:TRGP $O NYSE:COP $ NASDAQ:SITM NASDAQ:INSM NASDAQ:CAI NASDAQ:LFST NYSE:PAYC NYSE:RXO NYSE:ATI NYSE:MSI NYSE:PH $U NASDAQ:IOVA NYSE:RDW NASDAQ:MGNI NASDAQ:MTSI NYSE:DEO NASDAQ:HIMX NYSE:OSCR NASDAQ:CHYM NYSE:IONQ NYSE:ALB NYSE:GENI NYSE:COP NYSE:MCK
Other news:
NASDAQ:CLRO Cancels 437,500 First Finance Warrants at $5.00 Amid Cortigent Merger Process
NASDAQ:WYHG : no-news, low-float ADR pump
NASDAQ:PAVS : SEC filing confirming Paranovus closed its acquisition of the athletic wear brand Heyviva from Jabanero Inc.
NYSE:WPP : Sequential improvement, strong new business, and cost discipline set up a 2027 growth return
NASDAQ:MRNA secures FDA approval for its first mRNA influenza vaccine
NASDAQ:LIME surprised investors with firts earnings report after IPO.
GETTEX:LYY raises 2026 outlook again as Q2 soars past estimates
Space Stocks Are Roaring Back In August : NASDAQ:ASTS NASDAQ:RKLB NYSE:RDW
📉 Gap Downs
Reaction to earnings/guidance:
NASDAQ:SNDK NYSE:HUBS NASDAQ:DDOG NASDAQ:APP NASDAQ:CELH NASDAQ:WDC NYSE:FOUR NASDAQ:HONA NYSE:FIG NASDAQ:PTON NASDAQ:BLLN NASDAQ:MIRM NASDAQ:FLNC NASDAQ:RUN NYSE:KVYO NYSE:EPAM NASDAQ:VISN NYSE:BROS NASDAQ:QBTS NASDAQ:FISV NASDAQ:SNDK NASDAQ:DUOL NASDAQ:NVMI NYSE:ZTS NASDAQ:AXON NYSE:UWMC NASDAQ:CELH
Other news:
NASDAQ:YXT : Nasdaq Minimum Bid Price Requirement Compliance pump&dump.
Memory stocks falls in syphaty to NASDAQ:WDC NASDAQ:SNDK reports: NASDAQ:SKHY NYSE:CLS NASDAQ:MU
DeepSeek Plans ‘Significant’ Price Increase for Its AI Services, an unusual shift from the Chinese tech sector that has put pressure on US competitors with its aggressive pricing. NASDAQ:BIDU NYSE:BABA NASDAQ:NVDA
NASDAQ:CRWV Signs Multi-Year Agreement With Solidigm to Strengthen Its Integrated AI Cloud Platform
China has launched a cybersecurity review of products sold in the country by U.S. company Palo Alto Networks NASDAQ:PANW , citing risks to critical information infrastructure and national security, the country's cyberspace regulator said on Thursday.
‼️ Additional
NASDAQ:SPCX share lockup ends today, and it could trigger more selling (insiders and early investors will be able to sell their stock for the first time on Thursday, when 911.5 million shares become eligible to trade — around 43% more than the 638.9 million shares the company floated in its June initial public offering.)
NYSE:UBER has received its first license to launch driverless taxis in London.
Bezos sold Amazon NASDAQ:AMZN shares again, this time worth $346.5 million.
Daily trading volume in S&P 500 call options hit a new record.
-- US Treasuries came under selling pressure after the FT reported that Warsh is prepared to raise rates at the September meeting if inflation data released in the coming weeks remains elevated.
-- The percentage of S&P 500 stocks outperforming the index this year has risen to a 10-year high.
🏢 IPO
NASDAQ:BRVE – Braveheart Bio
Company develops treatments for hypertrophic cardiomyopathy, a serious heart disease where the heart muscle becomes abnormally thick and does not relax properly. Lead candidate BHB-1893 was licensed from Hengrui and is planned for global Phase 3 trials in both obstructive and non-obstructive HCM. Core thesis is a late-stage cardiovascular drug targeting a large market with high unmet medical need.
Price: $18.00
Shares: 21.3M
Raised: $382.5M
Market Cap: ~$1.32B
LTM:
Revenue: $0
Net Income: -$80.2M
Key point:
IPO was upsized and priced above the original range, while clinical data so far came mostly from Hengrui-run trials in China.
Comparable public companies: NASDAQ:CYTK , NYSE:BMY , NASDAQ:KARD , NASDAQ:ALNY , NASDAQ:IONS , AQUISEU:VERV
📋 List of tickers involved:
NASDAQ:SOUN NASDAQ:DASH NASDAQ:CEG NYSE:USFD NYSE:IONQ NYSE:LNG NYSE:HWM NYSE:OXY NYSE:MCK TSX:CNQ NYSE:TRGP $O NYSE:COP NASDAQ:SITM NASDAQ:INSM NASDAQ:CAI NASDAQ:LFST NYSE:PAYC NYSE:RXO NYSE:ATI NYSE:MSI NYSE:PH $U NASDAQ:IOVA NYSE:RDW NASDAQ:MGNI NASDAQ:MTSI NYSE:DEO NASDAQ:HIMX NYSE:OSCR NASDAQ:CHYM NYSE:ALB NYSE:GENI NASDAQ:CLRO NASDAQ:WYHG NASDAQ:PAVS NYSE:WPP NASDAQ:MRNA NASDAQ:LIME GETTEX:LYY NASDAQ:ASTS NASDAQ:RKLB NASDAQ:SNDK NYSE:HUBS NASDAQ:DDOG NASDAQ:APP NASDAQ:CELH NASDAQ:WDC NYSE:FOUR NASDAQ:HONA NYSE:FIG NASDAQ:PTON NASDAQ:BLLN NASDAQ:MIRM NASDAQ:FLNC NASDAQ:RUN NYSE:KVYO NYSE:EPAM NASDAQ:VISN NYSE:BROS NASDAQ:QBTS NASDAQ:FISV NASDAQ:DUOL NASDAQ:NVMI NYSE:ZTS NASDAQ:AXON NYSE:UWMC NASDAQ:YXT NASDAQ:SKHY NYSE:CLS NASDAQ:MU NASDAQ:BIDU NYSE:BABA NASDAQ:NVDA NASDAQ:CRWV NASDAQ:PANW NASDAQ:SPCX NYSE:UBER NASDAQ:AMZN NASDAQ:BRVE NASDAQ:CYTK NYSE:BMY NASDAQ:KARD NASDAQ:ALNY NASDAQ:IONS AQUISEU:VERV
Best regards – hi2morrow team.


SPY Tagged A New High At 776, Now Digesting.SPY Tagged A New High At 776, Now Digesting.
The trend is holding. SPY pushed to a new high at 776.81 overnight and has eased back to 771, digesting the gains while staying well above the 765 level that Wednesday flagged as the trend line. The move remains a clean uptrend with the higher-timeframe structure bullish. The hourly surface cooled to neutral on the pullback, which is normal consolidation after new highs. Extended, but constructive - a strong trend resting. Neutral.
Resistance: 776.81 - the new high
Key resistance: 778.00 - open air above
Current price: 771.19
Support: 768.15 - first support
Key support: 765.71 - the trend line
Structural floor: 759.67 - the prior high
Two paths from here:
It holds 765 and pushes 776.81 again. Digesting near a new high without giving back the trend line keeps SPY pressing higher. A break of 776.81 opens 778 and clean air. The trend and structure are aligned.
It pulls back deeper to backfill. A new high that gets sold can lead to a larger consolidation. A loss of 765.71 would signal the run needs a proper rest toward 759. Extended trends eventually mean-revert.
SPY tagged a new high and is digesting just below it - the uptrend is intact as long as 765 holds. New high, small pullback, trend line defended: this is what healthy trends do. 765 is the line that matters.
Built with SYNTHESIS v3.3 | SOM / ACE / IMP / SYNTHESIS
Study, not financial advice.


Is it possible for ETF to outlet stocks ?If you had invested in this company around 13 years ago and hold it till now, you would have made more than 551% or an average of 39% returns annually.
Compared to the S&P 500, it only gives you average of 8-10% at best so this ETF offers you 4x the returns AND it is not LEVERAGED , just a ordinary flavour ETF with low expense ratio !
Below are its top 10 holdings -
Key holdings portfolio weightsMasco Corp. (MAS): 2.93% asset allocation.Airbnb, Inc. (ABNB): 2.64% asset allocation.Brown-Forman Corp. (BF-B): 2.60% asset allocation.Kenvue Inc. (KVUE): 2.59% asset allocation.Bristol-Myers Squibb Co. (BMY): 2.47% asset allocation.Palo Alto Networks, Inc. (PANW): 2.45% asset allocation.Danaher Corp. (DHR): 2.44% asset allocation.Zimmer Biomet Holdings, Inc. (ZBH): 2.44% asset allocation.Mondelez International, Inc. (MDLZ): 2.44% asset allocation.The Charles Schwab Corp. (SCHW): 2.41% asset allocation.
I like that it excludes property and energy sectors are both are very cyclical in nature so if you want to hold long term, be prepared for its volatility.
I would put this on my alert list for price drop of 5-10% and accumulate ! Please DYODD
 Long
Long
$SPY & $SPX — Levels and Scenarios for Thursday, August 6, 2026🔮 AMEX:SPY & SPCFD:SPX — Levels and Scenarios for Thursday, August 6, 2026
📊 Key U.S. Economic Data (ET)
8:30 AM | Unemployment Claims | Forecast: 203K | Previous: 197K
⚠️ For informational purposes only. Not financial advice.
📌 #UnemploymentClaims #Jobs #EconomicCalendar
Long
6 years ago... Thailand market was HOT....then it cool down.....From the weekly chart, we see a nice breakout from the bearish trend line in early Jan this year...
It seems to have hit a resistance level around the 72 price level. I hope it would retrace to the buy zone around 60.93 and I would be keen to take a position.
For some overseas market, it is cheaper and better in risk diversification to buy into the ETF than to select individual stocks. To each his own......please DYODD
 Long
Long
Short term pain ahead?If the price next week come back down into that box and closes inside it on a weekly basis, then I think we will have a sharp decline for next 2-3 months. May be it will test 640 range. If this happens, then it could be a buying opportunity and a rally towards year end.
All the best !!

Chart Pattern Analysis Of TQQQ
From K1 to K5,
It is a first motive move of a newly-born bull trend.
The demands keep at high level and the price keeps creating a higher high.
At this case,
I am expecting a second motive wave after a short-term consolidation around the support.
If that is the case, I will try to buy back.
If the following candles successfully retest the upper limit of the bull gap at K4,
I will try to buy it.
 Long
Long
Is this a real break out? Part 2 8/5/26This is a follow up video that i just uploaded were we finish covering our thoughts on the SPX and we go over the QQQ and what is interesting about this chart is that it also has a parallel that I just recently found. IF we fail to make a new all time high and fall then we would still be in a technical down trend making lower highs and then we would have to wait and see if were making lower lows. Lets watch this market closely because we still very well can make a new all-time high on the Q's too but we have to be open to the idea that the parallel can cap price here.

SPY LIVE 5TH AUGUST 2026This is the price action for SPY. If you have any questions ,feel free to leave a message. I have explained in depth price action here with how the future anticipated trends would be.
NOTE :DO NOT TRADE BLINDLY

Is there really an alternative to long yields being high?As I see it, long yields should go down. Either the productivity of AI creates a huge deflationary preassure and yields most go down, or we will see AI flopping and a huge crash leading to yields going down... That is as long as we trust the dollar at least...
Long
$SPY 4hrSPY cooling off today after an aggressive rally, keeping an eye on 764.93 as a possible target as there is a fib fan / retracement confluence, there.
Short
SPY target 700Before I leave I'll put this up. I know many will scoff at the idea, but to me it's nothing more than an ABC with the Larger C next. So let's see how accurate this chart is once I get back.
This idea would likely confirm if SPY breaks below 750 and holds below that level. Any further price action above today's high will invalidate this idea.
Short
My Strategy Didn't Blow My Account. I Almost Did."My account's gone. The strategy must be broken."
That's the assumption most traders make when the red number shows up. I made it too, until I looked at what actually caused mine.
This May, my personal account went from up slightly to down around 17R in about ten minutes. Not from a bad trade. From a mis-clicked contract and a stop order I forgot was still live.
I was going long on NQ that day. TradingView had worked fine for two months. That day it wouldn't let me place the trade, so I switched to Tradovate, a platform I barely use.
That's where it went wrong. Not the strategy. Me.
Two Mistakes, Ten Minutes Apart
I don't trade on Tradovate often. That unfamiliarity is where the first mistake happened.
I meant to set a buy stop on MNQ, the micro contract I actually size for. I set it on NQ instead, the full-size contract. By the time I caught it, I was down $445. That's -2.2R on an account where breakeven was the actual right outcome.
I closed the position immediately and reopened the correct contract. Mistake one, contained.
Mistake two was already sitting there. The NQ order I'd just closed still had a stop attached to it, my real stop loss. I hadn't cancelled it. It wasn't an OCO order, so closing one leg didn't close the other. I didn't know a new position had opened.
I found out while I was still trying to fix the TradingView connection. I checked Tradovate and saw a position I hadn't meant to hold. Price had moved against it. Hard.
-$2,265. -11R. On a counter-trend position I never intended to be in.
That one stings to write. It wasn't a losing trade inside my system. It was a position I didn't know I was holding, on a platform I don't know well, with no OCO protection and no daily loss limit set.
Your Job Isn't Only To Enter And Exit
My trading plan didn't cause either mistake. My entry model, my risk per trade, my execution rules, none of that changed.
What failed was everything around the strategy. The platform I switched to under pressure. The order type I assumed was linked. The daily loss cap I'd never bothered to set because Tradovate isn't my main platform.
Most traders spend all their attention on the strategy. Win rate, entry model, stop placement, backtest data. That's the part you can see, so that's the part you defend.
But live trading asks more of you than entering and exiting correctly. It asks you to manage the environment the trade happens in. The platform. The order type. The account settings. Get any of those wrong and it doesn't matter how good your edge is.
I have a tested strategy. I've backtested it. None of that protected me from clicking the wrong contract.
What I Didn't Do Next
I could have held the NQ position and waited for price to come back to my entry before closing it. Some traders would have.
I didn't, because the position was counter-trend. If I'd held and hoped, and price kept going against me, the loss gets bigger, not smaller. I closed it the moment I saw it. Took the -11R. Wrote it down.
I know how this normally goes. I've seen plenty of traders make a mistake like this and not close it. They hold, hoping the market hands the mistake back to them. Sometimes it does. Often it doesn't, and they end up down -20R because they turned one accident into a second bet.
I don't hold and hope. Hope is not my trading strategy.
Why Protecting Capital Comes Before Everything Else
Since I opened this personal account on 29 April, the result would have been +0.8R in profit. Instead, after these two mistakes, the account is down around 17R.
It will take a while to climb back. Here's the part worth sitting with while it does.
A 20% drawdown needs a 25% gain to get back to breakeven. A 50% drawdown needs a 100% gain. The deeper the hole, the harder the climb out gets.
Winners and losers are not made the same. That's the actual reason protecting capital matters more than any single trade. Not to make you feel disciplined. To stop one mistake from turning into a hole that takes far longer to climb out of than it took to dig.
My personal account can absorb a 17R hit. It stings, but it doesn't threaten the account. The loss is covered by my prop firm profits. That's the only reason this is a bad month and not a blown account.
The Guardrail I Built After
I didn't change my trading strategy. Nothing about my entry model, my setup, or my rules caused this. Changing the strategy would have meant fixing a part that was never broken.
What I changed was the environment.
I'm resolving the TradingView-Tradovate connection issue so I'm not forced onto an unfamiliar platform mid-trade again. And I set a hard daily loss limit on Tradovate. $600, which is -3R. If the account is down that much in a day, I'm done for the day, no matter what the chart is doing.
That limit should have existed before I opened a single position on that platform. It didn't. Now it does.
Check Your Own Setup Before Your Next Trade
You can have a fully tested, profitable strategy and still lose money to something that has nothing to do with your edge. Wrong order size. An order type you assumed was linked. No daily loss cap on a platform you rarely use.
Open every platform you trade on today. Not just your main one, all of them.
Do you have a daily loss limit set? Do you know whether your stop orders are OCO? Would you actually notice if a position opened that you didn't intend to take?
If you can't answer all three, you have an open risk that has nothing to do with your strategy and everything to do with your environment.

Daily SPY Tactical Playbook - 05 AUGDaily SPY Tactical Playbook
Market Technical Outlook
Markets have regained strong bullish momentum following the latest geopolitical developments, fueling a broad wave of optimism. The result has been a series of aggressive breakout moves across the major indices.
In environments like this, the highest probability strategy is to trade with the prevailing trend unless new geopolitical headlines materially change the narrative.
Rather than chasing extended price action, we will focus on either breakout-and-retest opportunities or pullbacks into our predefined key demand zones.
Risk Index
Long-term: Risk On
Medium-term: Risk On
Short-term: Risk On
The Risk Index has officially shifted back into Risk On territory on the short-term timeframe, aligning with the current bullish price structure.
Scenarios / Strategies
Long Scenario 1
Scalp Buy (771)
If price successfully retests and reclaims this level with a confirmed 1-hour bullish candle close, long exposure can be considered.
Trigger: Retest of 771 followed by a bullish 1-hour candle close back above the level.
Targets: Take partial profits after every $1 advance.
Invalidation: 1-hour candle close below 771.
Long Scenario 2
Main Buy Zone (760.75)
This represents the primary institutional demand zone. If price retraces into this area and confirms support, long exposure can be established.
Trigger: Retest of 760.75 followed by a bullish 1-hour candle close back above the Main Buy Zone.
Targets: Take partial profits after every $1 advance.
Invalidation: 1-hour candle close below 756.
Position Management Rules
1. Entry model: Unique for every scenario. Read each setup carefully before entering.
2. Take profits in stages because market reversals can happen quickly.
3. After the first profit target is reached, move all remaining stop losses to breakeven and convert the position into a risk-free trade.
4. A reaction from the level must be confirmed. We do not predict price. We react to price.
5. Every scenario has its own invalidation level. Respect them without exception.
6. SPY & QQQ charts use RTH (Regular Trading Hours). ES & NQ futures charts use ETH (Electronic Trading Hours).
This analysis is for educational purposes only and reflects my personal opinion. It is not financial advice.
Long
VWRSI Crossovers & Extremes (Trading Tops & Bottoms)Stop Trading RSI Too Early — Wait for the Release 🚦
Most traders buy at oversold and sell at overbought. That often gets them in too early—or out of a strong trend too soon.
VWRSI improves the timing by waiting for momentum to leave the extreme and confirm with a cloud color change.
🔵 Blue dots on the chart was added to show you how the chart reacted to the horizontal yellow (extreme release & color change).
🟢 Bullish setup
VWRSI exits oversold + Cloud turns green
🔴 Bearish setup
VWRSI exits overbought + Cloud turns red
Trim, exit, or look for short setups
The chart shows why the best trade is often not at the extreme—but after momentum confirms the turn.
Education
SPY Is Holding New Highs At 774.SPY Is Holding New Highs At 774.
The trend is intact and the surface finally agrees. SPY held its gains and is trading 774, just under the 774.79 high, with the conviction engine now reading a bullish thesis and top-quartile. The divergence that had price and surface disagreeing on the break is gone - the surface caught up. The move from 748 to 774 is a clean trend now. The only caveat is how far and fast it has run: this is extended, and holding new highs after a vertical week invites a rest. Neutral.
Resistance: 774.79 - the high
Key resistance: 778.00 - open air above
Current price: 774.43
Support: 765.71 - first support
Key support: 759.67 - the prior high
Structural floor: 755.66 - the breakout base
Two paths from here:
It holds 765 and extends. With the surface now confirming and price at new highs, holding above 765 keeps the trend intact toward 778. A confirmed trend with the conviction surface on side is the strongest configuration there is.
It pulls back to digest the run. A near-vertical week into new highs is stretched. A loss of 765.71 and then 759 would signal a healthy backfill after the run. Extended trends rest; they do not go straight up forever.
SPY is holding new highs with the surface finally confirming the move - the break that started on a divergence has become a clean trend. The only question now is duration: it is extended, and even strong trends pause. 765 is the level that keeps it going.
Built with SYNTHESIS v3.3 | SOM / ACE / IMP / SYNTHESIS
Study, not financial advice.

Research 05.08.2026🌏 Markets:
AMEX:SPY +3.27 0.42%(pre/m)
NASDAQ:QQQ +1.17 0.16%(pre/m)
🆕 Economic News:
08:15 USA – ADP Employment Change
10:00 USA – ISM Services PMI
10:30 USA – EIA Crude Oil/Gasoline Stocks Change
📈 Gap Ups
Reaction to earnings/guidance:
NYSE:DIS NASDAQ:SHOP NYSE:ANET NASDAQ:UPST AMEX:GTE NASDAQ:APPS NASDAQ:TVTX $ COMP NASDAQ:QLYS NASDAQ:PGEN NYSE:DT NYSE:KMT NYSE:LRN NASDAQ:KTOS NASDAQ:BKNG NYSE:CRCL NYSE:LLY NASDAQ:WYNN NYSE:PSX NYSE:NVO NYSE:CVS NASDAQ:HONA NASDAQ:AMGN NASDAQ:ALAB NASDAQ:FRPT NYSE:SHAK NYSE:VSH
Other news:
NASDAQ:INOD Releases the First Stage of Its AI Cyber Training Suite to Enable AI Coding Agents to Write - and Repair - Secure Code
Private investors are pouring growing sums into artificial intelligence projects across the developing world : NASDAQ:NVDA NYSE:BABA
📉 Gap Downs
Reaction to earnings/guidance:
NASDAQ:SPCX NYSE:UBER NASDAQ:SEDG NASDAQ:AMD NASDAQ:TMDX NASDAQ:NICE NASDAQ:GFS NYSE:FLUT NASDAQ:WULF NYSE:ZETA NYSE:TDC NASDAQ:MTCH NASDAQ:VSAT NASDAQ:PODD NYSE:PINS NASDAQ:CDW NYSE:RRX NYSE:CPNG NYSE:DVA NASDAQ:GILD NASDAQ:EOSE CBOE:EOSU
Other news:
NASDAQ:AMIX Receives U.S. Patent for Precision Neuromodulation Platform Expansion
Caixin reported that Chinese mainland tax authorities have started levying personal income tax on returns from offshore insurance policies. : NYSE:PUK NYSE:PRU LSE:HSBA LSE:STAN
Samsung and NASDAQ:SKHY evaluate Chinese chip equipment as U.S. restrictions remain a concern\
NASDAQ:INTC NYSE:UMC NASDAQ:TSEM NASDAQ:MRVL falls in syphaty to AMD
NASDAQ:NBIS appoints Lindsey Irvine as Chief Marketing Officer
‼️ Additional
India has issued Zuckerberg a three-day ultimatum over the temporary removal of Modi’s address post — India Today. NASDAQ:META +1.5%.
The Trump administration has already returned more than $100 billion collected through tariffs following the Supreme Court ruling — FT.
SpaceX announced a partnership with Nvidia on AI satellites. Musk: In the future, we have decided to develop products exclusively on the NVIDIA platform. NASDAQ:NVDA
🏢 IPO
NASDAQ:ATTO – Attovia Therapeutics
Company develops next-generation biologic drugs for immune-mediated diseases using its ATTOBODY platform, a nanobody-based technology licensed from Alamar Biosciences. Lead candidate ATTO-1310 targets IL-31 and has completed Phase 1 dosing in healthy volunteers and patients with chronic itch and atopic dermatitis. Pipeline also includes programs for atopic dermatitis and inflammatory bowel disease.
Price: $17.00
Shares: 17.0M
Raised: $289.0M
Market Cap: ~$731.5M
LTM:
Revenue: $1.35M
Net Income: -$64.1M
Key point:
IPO was upsized from 12.5M to 17.0M shares and priced at the top of the previous range.
Comparable public companies: MYX:ALAM , NASDAQ:ROIV , NASDAQ:IMVT , NASDAQ:ARGX , LSE:APLS , LSE:TERN
📋 List of tickers involved:
AMEX:SPY NASDAQ:QQQ NYSE:DIS NASDAQ:SHOP NYSE:ANET NASDAQ:UPST AMEX:GTE NASDAQ:APPS NASDAQ:TVTX NYSE:COMP NASDAQ:QLYS NASDAQ:PGEN NYSE:DT NYSE:KMT NYSE:LRN NASDAQ:KTOS NASDAQ:BKNG NYSE:CRCL NYSE:LLY NASDAQ:WYNN NYSE:PSX NYSE:NVO NYSE:CVS NASDAQ:HONA NASDAQ:AMGN NASDAQ:ALAB NASDAQ:FRPT NYSE:SHAK NYSE:VSH NASDAQ:INOD NASDAQ:NVDA NYSE:BABA NASDAQ:SPCX NYSE:UBER NASDAQ:SEDG NASDAQ:AMD NASDAQ:TMDX NASDAQ:NICE NASDAQ:GFS NYSE:FLUT NASDAQ:WULF NYSE:ZETA NYSE:TDC NASDAQ:MTCH NASDAQ:VSAT NASDAQ:PODD NYSE:PINS NASDAQ:CDW NYSE:RRX NYSE:CPNG NYSE:DVA NASDAQ:GILD NASDAQ:EOSE CBOE:EOSU NASDAQ:AMIX NYSE:PUK NYSE:PRU LSE:HSBA LSE:STAN NASDAQ:SKHY NASDAQ:INTC NYSE:UMC NASDAQ:TSEM NASDAQ:MRVL NASDAQ:NBIS NASDAQ:META NASDAQ:ATTO MYX:ALAM NASDAQ:ROIV NASDAQ:IMVT NASDAQ:ARGX LSE:APLS LSE:TERN
Best regards – hi2morrow team.

Spy moving up overnightGreat for spx calls if you're already in them.
im already in calls that are up overnight it can keep going in this direction. however RSI sell signals are going.

VOO: Bullish Breakout!The Vanguard S&P 500 ETF (VOO) trades near $708.72 to $711.25, showing steady upward momentum supported by recent gains in major technology and semiconductor holdings. Broad market sentiment remains positive as large cap U.S. equities recover from previous infrastructure spending jitters.
Technical Outlook:
VOO recently broke above the resistance zone, at $699, after its horizontal consolidation for a couple of weeks, in respect to the structure. Price is likely to make a retest of breakout, as we anticipate a buy continuation.
Key Points:
Hold on your buy position, with a target at $730, as next potential bullish.
Thanks for reading.
 Long
Long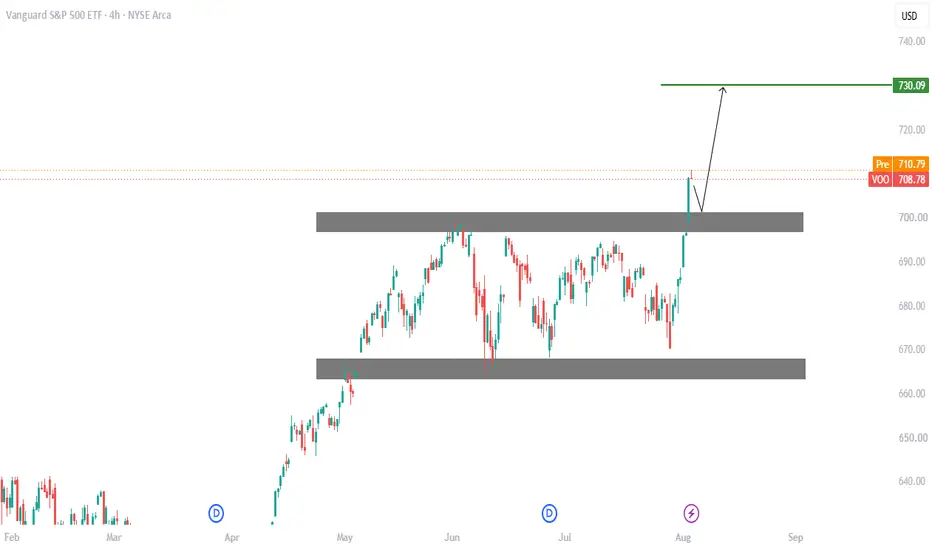
SPY: The Matryoshka Pattern Points to Massive Downside TargetWe have a fascinating "Matryoshka" (nested) ABC correction pattern developing on the 1-hour SPY chart. While the market has seen a recent short-term bounce, the macro structure remains heavily bearish as long as key resistance levels hold.
Here is the breakdown of why the Orange Matryoshka (C) Target is very much on the table.
📉 The Setup & Nested Structures
The chart shows a sequence of nested ABC correction waves playing out perfectly:
The Micro Black ABC: Completed its corrective bounce right into the designated target box near $755$.
The Inner Pink ABC: Triggered a sharp decline from the June 15th high, finding a temporary bottom near the $715$ area.
The Macro Orange Matryoshka: This is the overarching pattern driving the larger trend. The initial impulse leg down (A) and the subsequent corrective rally (B) are fully locked in.
🎯 Target and Invalidation Levels
The macro structural thesis is simple: We are tracking the major Wave (C) extension lower.
The Ultimate Target: The orange ABC Target zone sits between $680.00 and $695.00 .
The Invalidation Level: A clean break and daily close above the Wave (B) high (~$757.00) invalidates this entire bearish macro outlook. If price invalidates here, the bearish structure breaks, and we look for new highs.
🔄 Current Price Action (The Pivot Point)
Right now, price is consolidating inside a Weekly Control Level (WCL) bounce zone around $745.00 .
Bearish Case: This recent rally looks corrective, retesting broken structures. As long as it remains capped under the Invalidation line, the gravity of the large orange (C) target remains the dominant directional force.
Execution Note: It may take time, and we could see more choppy consolidation around the $745$ level before the next major leg down accelerates, but for now, the path of least resistance points lower.
Risk Management: Always protect your capital. A strict stop-loss or invalidation trigger sits just above the Wave (B) peak. If they break that, the bears lose control.
What do you think? Will the Matryoshka pattern fully play out to the $680–$690 zone, or will the bulls squeeze past the invalidation line? Let me know in the comments! 👇
Short
Koru up over next few weeksPrice rebounded at support with a long wick at around $12 in conjunction with trendline from Sep 2025 and followed by a bullish engulfing. Koru long over the next few weeks if this floor continues to hold.
 Long
Long
TQQQ: Is This The Bottom?Sure it is ladies and gentlemen at least for this coming bounce that is around the corner.
This aftermarket move down is a gift from the Gods for a good entry.
We have our Daily and 4hrs TFs Bullish Setup and entering our Buy Zone, NO IFs or BUTs.
We have another retrace after this coming bounce so just make some money and get out.
How high it will go? that nobody knows but probably to test the $70.00 area.
Play it right.................Play it safe............Play it The Numberfive Way.
Boost...................Follow......................Share................Comment.
Long