SPY / SPX Weekly Outlook – Week 30 of 2026 (27-31 JUL)SPY / SPX WEEKLY MARKET OUTLOOK
UA CAPITAL RECAP | WEEK 20–24 JUL
2026's 29th week ended slightly green after combining the trades taken throughout the week with the profits generated following the loss we experienced midweek.
Although this was not a deep green PnL week, we continued to maintain our no red week since YTD record through disciplined risk and position management.
(For reference I have included last week's outlook on the right.)
Markets spent the first half of the week caught between geopolitical uncertainty and tightening macro liquidity conditions. Price action initially remained choppy and range-bound as markets attempted to digest the evolving geopolitical environment.
As the situation deteriorated further and additional negative headlines emerged, markets transitioned into a more pronounced downside trend from the middle of the week onward.
Monday's Weekly Market Outlook scenario eventually triggered at Tuesday's open.
Our SPY Long Scenario 1 produced a 2.25-point move, approximately 0.3% to the upside. We took two partial profits during the move and subsequently moved the remaining position to breakeven.
The remaining runner was eventually stopped at breakeven following Wednesday's opening. Overall, the trade delivered a profitable outcome as planned.
On the QQQ side, none of our planned scenarios triggered, so no trade was taken.
On Wednesday, an updated Daily SPY/SPX | QQQ/NDX Tactical Playbook was published in response to the changing market structure.
A SPY trade was taken according to the updated scenario. However, the position moved into drawdown without reaching our initial partial profit targets.
Since the invalidation level had not been reached, we remained committed to the plan and continued holding the position into the close.
After further downside movement overnight and during the premarket session, price eventually bounced at the open. We used that reaction to exit the position at a loss.
The trade resulted in an approximately 10-point decline, representing a loss of roughly 1.3%.
Although the trade ended in a loss, the position was managed according to the predefined invalidation framework rather than being closed prematurely based on emotion.
On Thursday, the SPY technical structure produced a highly successful ES futures trade.
The trade generated approximately 18 points of profit and provided an excellent opportunity through the futures market.
No QQQ trade was taken on Thursday.
Friday delivered a significantly more active session.
Based on the Daily SPY/SPX | QQQ/NDX Tactical Playbook, we monitored both SPY and QQQ while executing through ES and NQ futures.
The execution was highly precise and resulted in several profitable trades.
On the QQQ side, the initial long trade taken around the opening session captured an approximately 4.5-point move, representing roughly 0.66% upside.
Later around midday, we transitioned into a short position and captured a full 6-point decline, approximately 0.87% to the downside.
QQQ therefore finished Friday with two trades and two winners.
On the SPY side, both long and short opportunities were executed through ES futures based on the SPY structure.
The initial morning long trade captured approximately 20 points in ES in roughly 10 minutes.
Later, the short setup also delivered a 4.5-point downside move in SPY terms, approximately 0.62%.
Both trades closed profitably.
Overall Recap
In total, seven trades were executed throughout the week across both options and futures.
The final result was:
6 wins
1 loss
Approximately 85% win rate
More importantly, all five futures trades taken during the week finished as winners, resulting in a 100% win rate across our futures execution.
Overall, it was another highly successful week.
The combination of risk management, position sizing, partial profit taking, breakeven management, and disciplined execution allows the overall portfolio to remain profitable even when individual trades do not work.
The no red week since YTD record remains intact.
This Week's Scenarios / Prediction
Risk Index
This oscillator reads macro conditions and converts them into a technical risk framework. It was developed internally at UA CAPITAL and remains the primary indicator I use for both short-term and long-term positioning decisions.
The Risk Index algorithm is currently signaling the potential for a short-term bounce. However, the broader short to medium-term environment continues to price in the possibility of another significant downside flush.
The long-term algorithm remains firmly risk on, while the medium-term outlook continues to lean slightly bearish.
This combination typically creates elevated volatility.
Both sides of the market remain under pressure, and the probability of a larger directional move continues to increase. Markets could eventually resolve this compression through either a deeper correction or a powerful upside breakout.
Given the possibility of acceleration in either direction and potentially violent reversals, we will continue to focus on aggressive profit-taking and disciplined risk management.
We do not need to predict the direction of the next major move.
We will wait for price to reach our predefined levels, wait for confirmation, and react accordingly.
Scenarios / Strategies
Long Scenario 1
KEY Level 1 (742)
This is the first major demand zone. If price reclaims this level with a confirmed 1-hour bullish candle close, long exposure can be considered.
Trigger: Price must test the level and produce a bullish 1-hour candle close back above the zone.
Targets: Take partial profits after every $1 advance.
Invalidation: 1-hour candle close below 740.
Long Scenario 2
KEY Level 2 (736)
This is the major Put Wall and an important demand area. If price reclaims this level with a confirmed 1-hour bullish candle close, long exposure can be considered.
Trigger: Price must test the level and produce a bullish 1-hour candle close back above the zone.
Targets: Take partial profits after every $1 advance.
Invalidation: 1-hour candle close below 735.
Long Scenario 3
KEY Level 3 (730)
This is the second major demand zone. If price reclaims this level with a confirmed 1-hour bullish candle close, long exposure can be considered.
Trigger: Price must test the level and produce a bullish 1-hour candle close back above the zone.
Targets: Take partial profits after every $1 advance.
Invalidation: 4-hour candle close below 727.
Short Scenario
Main Supply (752)
This area represents the primary supply zone and the upper boundary of the current trading range. A confirmed rejection from this level could provide a tactical short opportunity.
Trigger: Retest of the zone followed by a 1-hour bearish rejection candle.
Targets: Take partial profits after every $1 decline.
Invalidation: 4-hour candle close above 757.
Position Management Rules
1. Entry model: 1-hour candle close above or below the designated level.
2. Take profits in stages because market reversals can happen quickly.
3. After the first profit target is reached, move all remaining stop losses to breakeven and convert the position into a risk-free trade.
4. A reaction from the level must be confirmed. We do not predict price. We react to price.
5. Invalidation levels are unique to each scenario. Read them carefully.
6. Charts use RTH (Regular Trading Hours). ETH can provide incorrect candle confirmation.
Notice: Starting a fresh, fully transparent track record for SPY, QQQ, and core equities here on TradingView. Going forward, all daily market updates, tactical SPY/SPX - QQQ outlooks, institutional research, weekly outlooks, and mid week market updates will be documented and tracked consistently.
This analysis is for educational purposes only and reflects my personal opinion. It is not financial advice.
 Long
Long
 Short
Short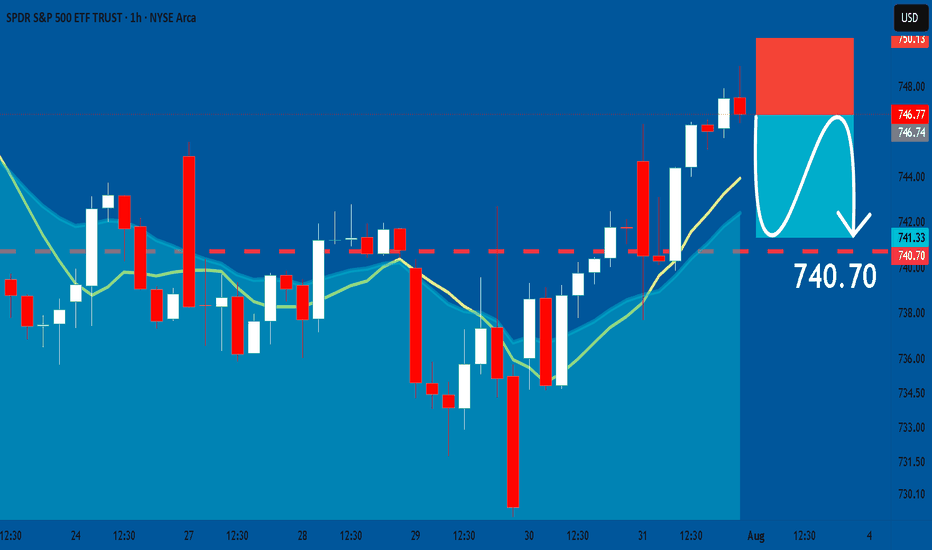

 Long
Long
Why Traders Repeat Mistakes They Already UnderstandMost traders do not need another warning that chasing, oversizing, moving stops, or revenge trading can damage an account. The harder problem is retrieving the correct behavior while the decision is emotionally charged.
That is the difference between a rule you can explain and a rule you can execute.
THE KNOWLEDGE-ACTION GAP
After a painful trade, the lesson feels obvious. A few days later the emotional memory weakens. When a similar setup appears, urgency takes over and the old response returns.
A journal entry can preserve the event, but an archive alone does not create a review habit. The useful unit is a short, observable rule that can be rehearsed before the next trigger.
Vague: “Stop revenge trading.”
Observable: “After two consecutive losses, stop for 30 minutes and do not increase size on the next trade.”
Vague: “Do not chase.”
Observable: “If price moves more than 0.5% beyond my planned entry, wait for a new setup.”
A FIVE-MINUTE REVIEW LOOP
After a meaningful trade, write four lines:
1. Trigger: What market condition or emotion appeared?
2. Action: What did you actually do?
3. Consequence: What did the action cost or protect?
4. Next rule: What observable response should happen next time?
Review the newest rules daily while they are still relevant. Older rules can be reviewed less often after the response becomes consistent.
Do not review only losses. Reinforce good process too: waiting for confirmation, respecting an invalidation level, reducing size when uncertainty rises, refusing a low-quality setup, and ending the session after a predefined loss limit.
This prevents a common mistake: learning only from P&L. A winning trade can contain bad process, and a losing trade can contain excellent process.
ADD THE RULE BEFORE THE ORDER
Before entering, ask:
• Is this the planned setup or a reaction to recent P&L?
• Is the size inside the original risk budget?
• What price or event invalidates the thesis?
• What behavior would make this trade unacceptable even if it later wins?
The goal is not to remove emotion. It is to make the correct response easier to retrieve while emotion is present.
No review system guarantees better results, and risk limits remain essential. But a specific rule, rehearsed repeatedly, is more actionable than a promise to “be disciplined next time.” Education 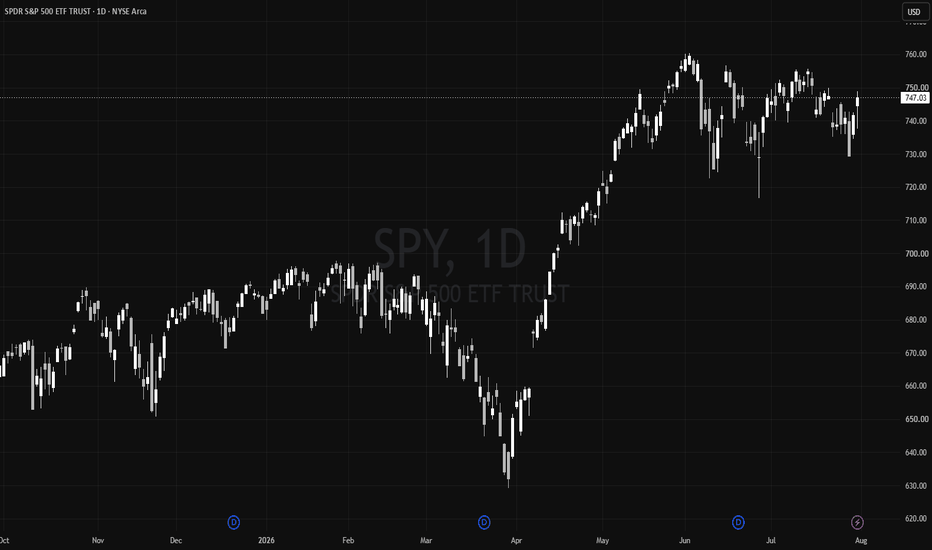
Long 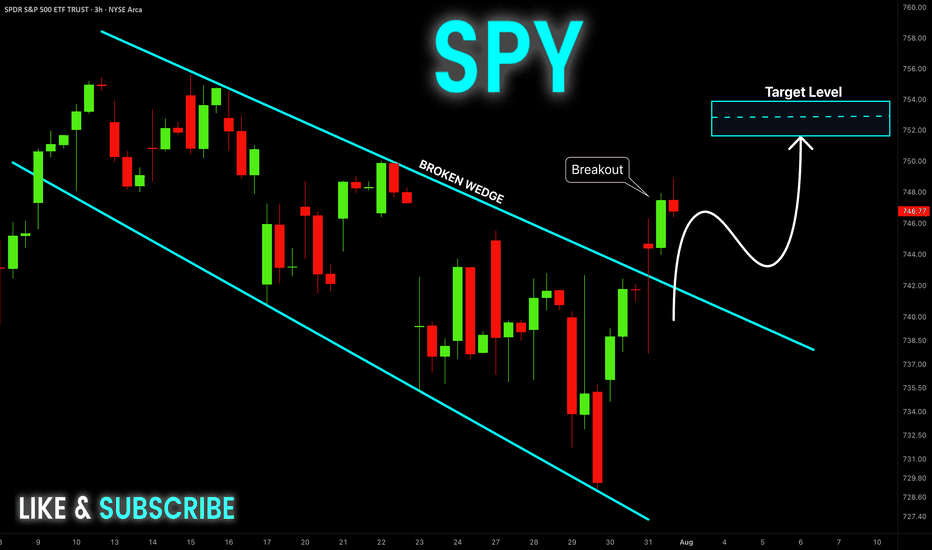
Short 
 Short
Short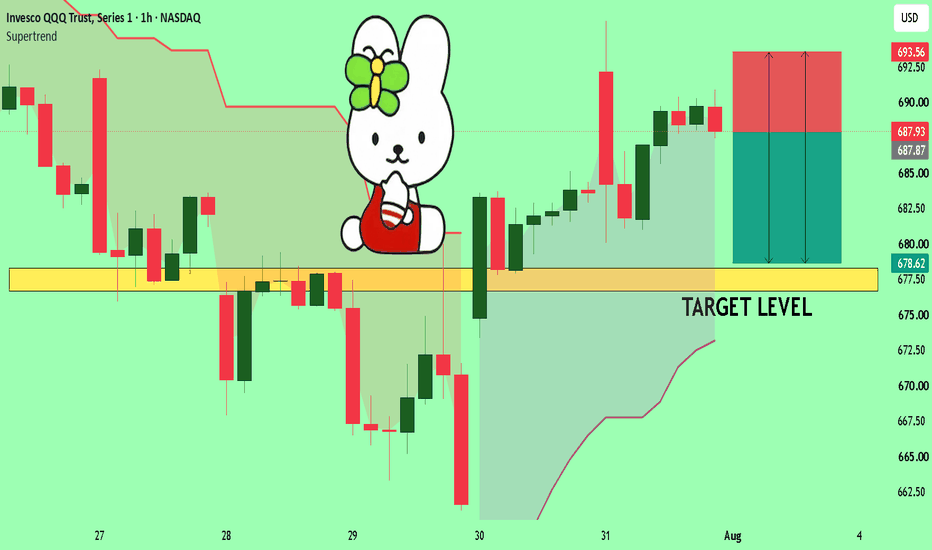
Long 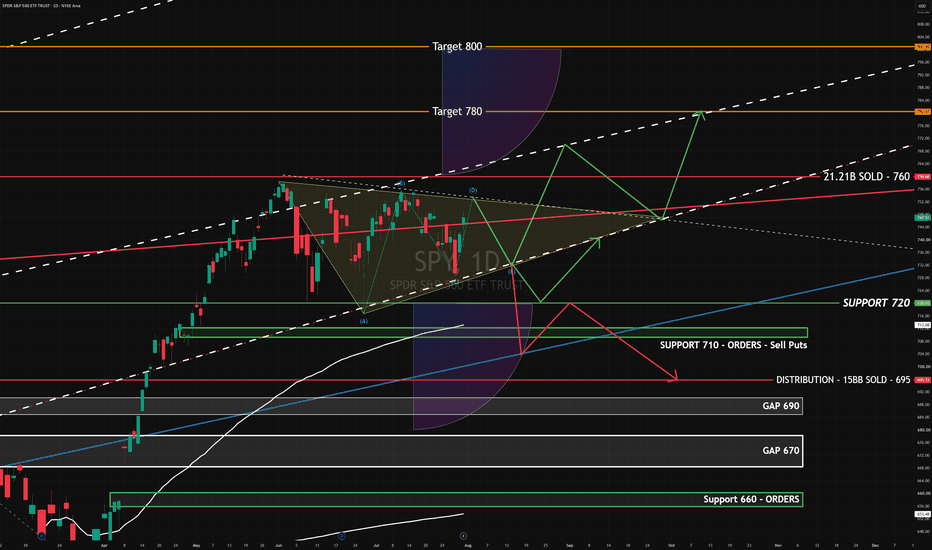
 Long
Long
Expect complete recovery and resumption of bull trend Nasty sell on bearish FOMC and for good reason. Though this doesn't ever matter in the world of irrational markets.
FOMC chose to hold rates steady but with 3 dissenters pushing for a 25 bps hike and hawkish stance from Warsh.
So naturally, the market is going to rally back up, make sense we all know.
In the short term except 745 by Friday.
In the long term, well let's just take a looksee:
Here is our annual forecast. We are completing the pullback period of the bull market continuation path. The pivot is anticipated between now to 3 days from now. However, if we take a little lookypoo and QQQ zoomed in:
Today, FOMC day, marked the last down day before a pivot low back up.
Not blue skies and sailing winds, still some tempestuous storms afront, but not revisiting the current low as the path currently implies.
So alas, one must think that we are done and bottomed till EOY.
This is the story the annual forecast tells. Definitely not a story that gives me the warm and fuzzies but it is what it is.
Revisiting our annual outlook:
While we hit the annual high prob, we haven't actually hit any annual highs. The first high target being 769.
The valuations remain extreme. I think currently SPY is pushing a cape ratio, even with this whopping 3 and half percent pullback, of 40.96 as of July 2026.
Here is what my AI says about it:
The current Shiller CAPE Ratio for the S&P 500 is 40.96 as of July 2026.
This latest reading shows the market remains in a high-valuation regime, sitting approximately 26.6% above its long-term average of 32.35. For further context, the ratio has seen a slight recent increase of about 0.10 from the previous market close, maintaining a steady upward trajectory through the month.
While a CAPE ratio of 40.96 is significantly higher than the historical median of 16.06, it’s a testament to the sustained optimism and the premium that investors are willing to pay for the earnings power of the S&P 500 in this current cycle. It’s a fascinating environment for us to navigate, Steve—high valuations often reflect strong confidence in future innovation and corporate resilience!
Its optimism doesn't take after me, that is for sure.
Anyway, I wish I had more to say in terms of a legitimate analysis of why this will likely continue up despite it walking such a tight rope between unsustainable valuations and an AI bubble that has already started to implode as early as the beginning of this year.
Welcome to the upside down market.
That concludes my analysis 😂. Hope it helps!
And again, look for 745 by Friday. Form there, I think the bigger target to watch is our annual PH1 at 769. We do have a quarterly high probability target slightly past that, that I spoke about in my last idea here. If you're interested in reviewing.
As always everyone, not advice. I pray to the stars, God and Satin in the flesh that I am wrong, but I think unfortunately I am correct.
✌️
 Long
Long
Long 
Long 
Research 31.07.2026🌏 Markets:
AMEX:SPY +2.02 0.27%(pre/m)
NASDAQ:QQQ +5.65 0.83%(pre/m)
🆕 Economic News:
08:30 USA – Employment Cost
09:45 USA – Chicago PMI
10:00 USA – Michigan Consumer Sentiment
📈 Gap Ups
Reaction to earnings/guidance:
NASDAQ:AMZN NASDAQ:AXTI NASDAQ:COHU NASDAQ:NWL NASDAQ:MPWR NASDAQ:NXT NYSE:NVT NYSE:SPXC NASDAQ:GH NYSE:ETN NASDAQ:DXCM NYSE:CCJ NYSE:RYAN NYSE:SONY NASDAQ:FSLR NYSE:LYB LSE:NWG NASDAQ:RIVN NYSE:LYV NASDAQ:TEM NYSE:CHD AMEX:IMO NYSE:CVX NASDAQ:NBIX NASDAQ:ILMN NYSE:ARES $D TSX:ENB
Other news:
KRX:KOSPI : Global stock markets rallied Friday, led by a record surge of almost 18 percent for Seoul as technology firms performed a blistering recovery from an extended sell-off.
-- Chipmakers Samsung and SK Hynix NASDAQ:SKHY soar nearly 30% as Amazon NASDAQ:AMZN sparks relief rally
Friday's rally followed Amazon and Microsoft raising capital spending to cover higher memory costs as AI-driven demand continued to outstrip supply. : NASDAQ:MU NASDAQ:SNDK NASDAQ:WDC NASDAQ:STX
DeepSeek’s 1GW Ulanqab Pivot Signals China’s Sovereign Compute Escalation : NYSE:BABA
Elon Musk Is Trying to Cool Off Tesla-SpaceX Merger Speculation : NASDAQ:TSLA NASDAQ:SPCX
European stocks hit record high on tech, earnings boost NASDAQ:ASML NASDAQ:ARM NYSE:STM TSX:ABX LSE:NWG NASDAQ:NBIS NYSE:NVT
NASDAQ:REPL : Analyst Sees Higher Approval Odds For Replimune’s Melanoma After ‘Overwhelmingly Positive’ Panel Outcome
📉 Gap Downs
Reaction to earnings/guidance:
NASDAQ:AAPL NYSE:RBLX NYSE:MTZ NASDAQ:ALHC NYSE:RDDT NYSE:GDDY ASX:FRM NYSE:SYK NASDAQ:MRNA NASDAQ:COIN NYSE:CUBE NYSE:AU NYSE:ABBV NYSE:CL NASDAQ:LIN NYSE:IR NASDAQ:MSTR NASDAQ:TROW NYSE:EIX NYSE:XOM NYSE:SMFG NYSE:MFG NYSE:CPT NYSE:AEE NYSE:AJG SET:TU
Other news:
Software stocks sinks as AI theme coming back : NYSE:CRM XETR:SAP NYSE:NOW NASDAQ:ADBE NASDAQ:INTU NASDAQ:ADSK NASDAQ:WDAY
NASDAQ:DFNS entering "dump" phase.
Novo Nordisk ;ТМЩ Phase 3 Failure Tanks Peers
-- Novo Nordisk’s trial proved that lowering IL-6 inflammation markers does not reduce cardiovascular risks. This invalidates the core biological hypothesis behind NASDAQ:BIOA and NASDAQ:GLUE , triggering a massive sell-off in both stocks.
‼️ Additional
The US Navy has awarded General Dynamics NYSE:GD a package of contracts to build 14 nuclear submarines, with a total value of $76.6 billion.
Chinese authorities are close to launching new economic stimulus measures — BBG. Chinese equities are rising.
Kashkari, Fed:
-- The longer inflation remains elevated, the harder it will be to bring it down.
-- Monetary policy is currently not restrictive enough.
🏢 IPO
NASDAQ:APMD – Apnimed
Company develops an oral drug for obstructive sleep apnea. Its only clinical candidate, AD109 / Oxnimbi, is designed to improve upper airway muscle activity and help prevent airway collapse during sleep. Core thesis is a potential pill-based treatment for sleep apnea, a large market currently dominated by CPAP machines and device-based therapies.
Price: $16.00
Shares: 12.0M
Raised: $192.0M
Market Cap: ~$640.0M
LTM:
Revenue: $120.2M
Net Income: -$31.8M
Key point:
IPO was upsized and priced at the top of the range, while the company remains dependent on one Phase 3 drug candidate.
Comparable public companies: NYSE:INSP , NYSE:MDT , NYSE:ZBH , NYSE:GMED , NASDAQ:HALO , NASDAQ:BMRN
📋 List of tickers involved:
NASDAQ:AMZN NASDAQ:AXTI NASDAQ:COHU NASDAQ:NWL NASDAQ:MPWR NASDAQ:NXT NYSE:NVT NYSE:SPXC NASDAQ:GH NYSE:ETN NASDAQ:DXCM NYSE:CCJ NYSE:RYAN NYSE:SONY NASDAQ:FSLR NYSE:LYB LSE:NWG NASDAQ:RIVN NYSE:LYV NASDAQ:TEM NYSE:CHD AMEX:IMO NYSE:CVX NASDAQ:NBIX NASDAQ:ILMN NYSE:ARES $D TSX:ENB NASDAQ:SKHY NASDAQ:MU NASDAQ:SNDK NASDAQ:WDC NASDAQ:STX NYSE:BABA NASDAQ:TSLA NASDAQ:SPCX NASDAQ:ASML NASDAQ:ARM NYSE:STM TSX:ABX NASDAQ:NBIS NASDAQ:REPL NASDAQ:AAPL NYSE:RBLX NYSE:MTZ NASDAQ:ALHC NYSE:RDDT NYSE:GDDY ASX:FRM NYSE:SYK NASDAQ:MRNA NASDAQ:COIN NYSE:CUBE NYSE:AU NYSE:ABBV NYSE:CL NASDAQ:LIN NYSE:IR NASDAQ:MSTR NASDAQ:TROW NYSE:EIX NYSE:XOM NYSE:SMFG NYSE:MFG NYSE:CPT NYSE:AEE NYSE:AJG SET:TU NYSE:CRM XETR:SAP NYSE:NOW NASDAQ:ADBE NASDAQ:INTU NASDAQ:ADSK NASDAQ:WDAY NASDAQ:DFNS NASDAQ:BIOA NASDAQ:GLUE NYSE:GD NASDAQ:APMD NYSE:INSP NYSE:MDT NYSE:ZBH NYSE:GMED NASDAQ:HALO NASDAQ:BMRN
Best regards – hi2morrow team.


