good entry on monday , tuesdayThis is my personal trading journal, published for educational purposes. It is not financial advice, and I am not your financial advisor. The Socrates timing arrays and reversal system are Martin Armstrong’s work (AE Global Solutions); I use them under my own interpretation and execution rules. Leveraged ETFs like BOIL carry decay and issuer risk and are not buy-and-hold instruments. Trading involves substantial risk of loss. Do your own work, size for the loss, and never risk what you can’t afford to lose.
ETF market
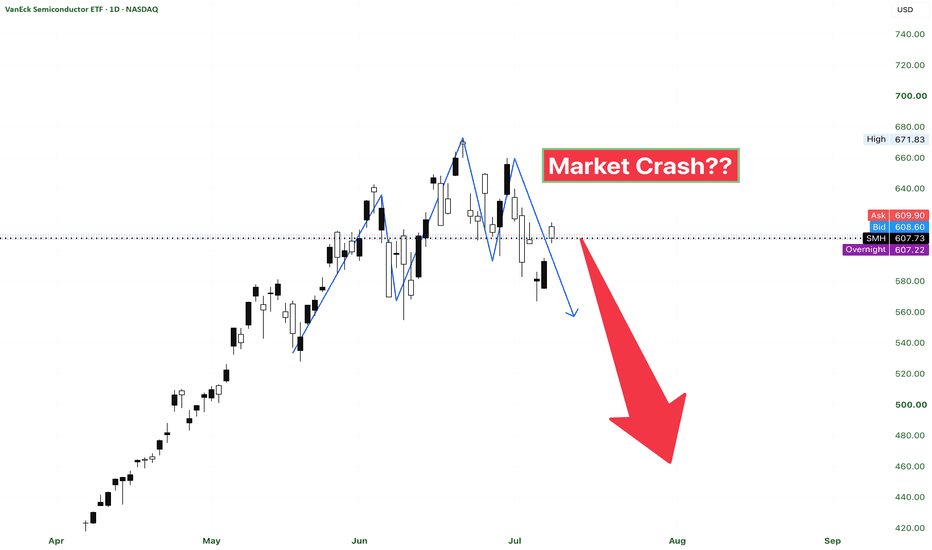
Is the top in on the market.Well, well , well smh looks a bit toppy here. Looks like its hitting resistance at $618.
If we reject tomorrow then we go lower to $595. Above this level is New ATH's. Let's see what happens.
This is for educational purposes only and does not constitute as financial advise. Watch and like the video. Also, first 5 peoples the comment I will breakdown one stock of their choice.
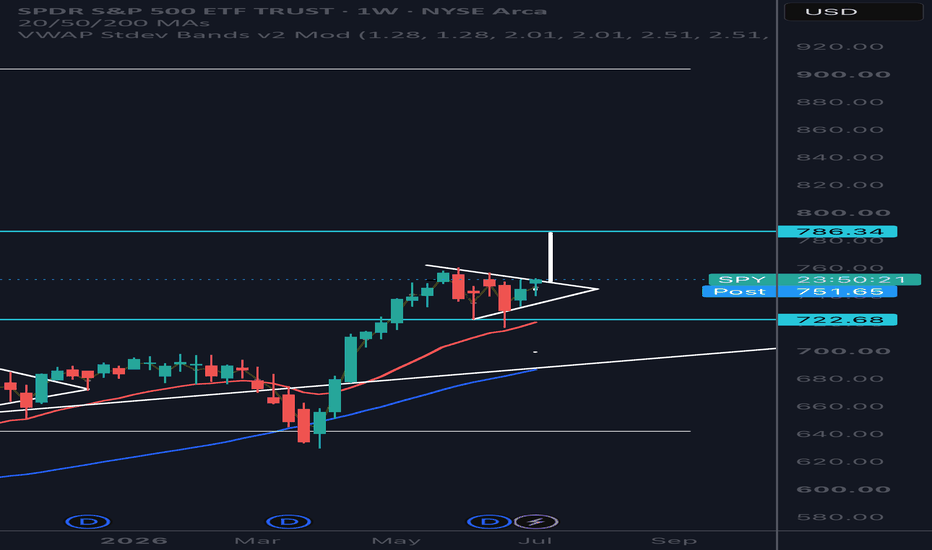
SPY Breakout ? seems like after these last few weeks of a lot of Bear price action we still were not able to break down fully. During this consolidation we created a symmetrical triangle and it looks to me like we are currently attempting a breakout of this. The resistance of the symmetrical triangle is around 751.17. I still would like to see us pop above 753 and start flipping 752 previous resistance into new support before I can get a little more confident on this breakout, but we have had a very strong push up into this resistance a beautiful pullback off of that move as the back test and another push into the previous area. If this thing does break to the upside, we actually have a target of $785 Will SPY make new all-time highs again? Or do we have to pull back in for another test of the lower support of this pattern which is around $735
I do see that we had a little bit of a bear trap/capitulation when we went down to 716 We did have a great bounce off of that area. Looks like a lot of buyer stepped in? Was it enough to push us in the new all-time highs or was it a warning shot of where we are potentially heading if we failed this breakout?
I believe that if we can close this week above 752 that could be a great start for the next coming weeks to continue pushing into new ATh. What are your thoughts?
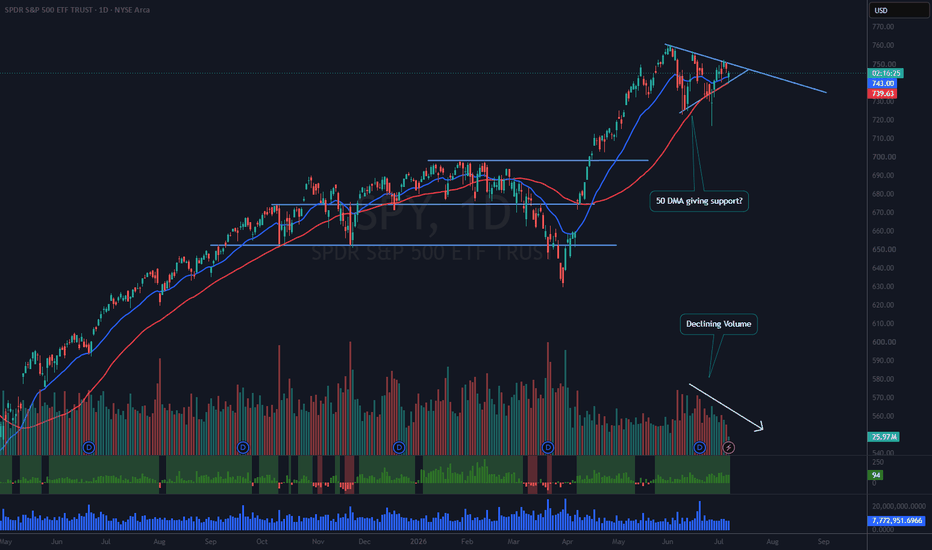
$SPY Volatility Contraction Pattern (VCP)Setup
AMEX:SPY is forming a volatility contraction pattern (VCP). After several weeks of elevated volatility, price action appears to be tightening, with higher lows developing even as lower highs continue to cap the range. At the same time, volume is drying up, which supports the idea that the pattern is consolidating.
Trade Bias
This pattern can break in either direction, so confirmation matters. My current bias is bullish, and I am watching for a break above the upper downtrend line. If that breakout occurs, I plan to consider a trade using AMEX:SSO as a leveraged proxy, since the AMEX:SSO chart has a similar setup.
Risk Management
If I take the trade, I will place my stop below the most recent daily low.
Reminder
If this idea fits your process, make it your own and follow your trading or investing rules. After all, it is your money.
qqq monthly view.taking a peak at the monthly count on qqq,
which btw has the cleanest count in all of the markets.
---
it looks like wave 3 has been put in through a 2.618 extension;
which would imply that a major wave 4 is at play.
Wave 4 generally retraces 23~38% of wave 3,
so that would give qqq at a conservative downside target of $211.
worst case scenario at $140 (unlikely).
Wave 2 took 400 days to pan out,
so if this wave 4 took 1:1 to play out in time ratio,
we'd be looking for a bottom around December of 2022.
---
Wave 5 target sits at $789, and it would take many years to get there.
💰
Semis Trading Plan: Buy the Reclaim or Buy the Flush?Semis just gave us their first real test of the 50 EMA since the April run started. Price tapped 546 yesterday, printed a rejection wick, and bounced. Textbook so far. First test of a rising 50 EMA after a strong trend leg usually gets bought.
But here's what I'm actually watching, and it's above price, not below.
We lost 584.50, the floor of the entire June consolidation. That level is now overhead resistance, with the 20 EMA falling right into it. That double layer at 584-585 is the lock on this chart.
Volume isn't helping the bulls either. The biggest recent bars are red. That looks more like distribution than a quiet pullback.
So here's my framework : Support is the 533.74 - 546 zone, horizontal level plus rising 50 EMA. Resistance is 584.50. Between the two, it's a decision range, nothing more. I will not get excited with price action within that area. IMO: reclaim 584.50 on a daily close and this pullback was just a breather. 629.72 and then the highs come back into play.
Lose 533.74 on a daily close and the range breaks down. First stop 506.94, but the real buy zone sits lower where the rising 100 EMA converges with the 463-484 shelf. That's where I'd expect the serious bounce IF we purge.
RSI sitting at 45, momentum fully reset, not oversold. Room in both directions, so price decides, not the oscillator. If we retest 533, watch for RSI to print a higher low against a marginal price low. That divergence would be the bull signal worth acting on.
Important to note : Price may continue to trade sideways until the next semis earnings. I would avoid leveraged ETFs, as time decay could significantly erode their value.
This is my personal technical analysis and trading plan, not financial advice. Always do your own research before making investment decisions.
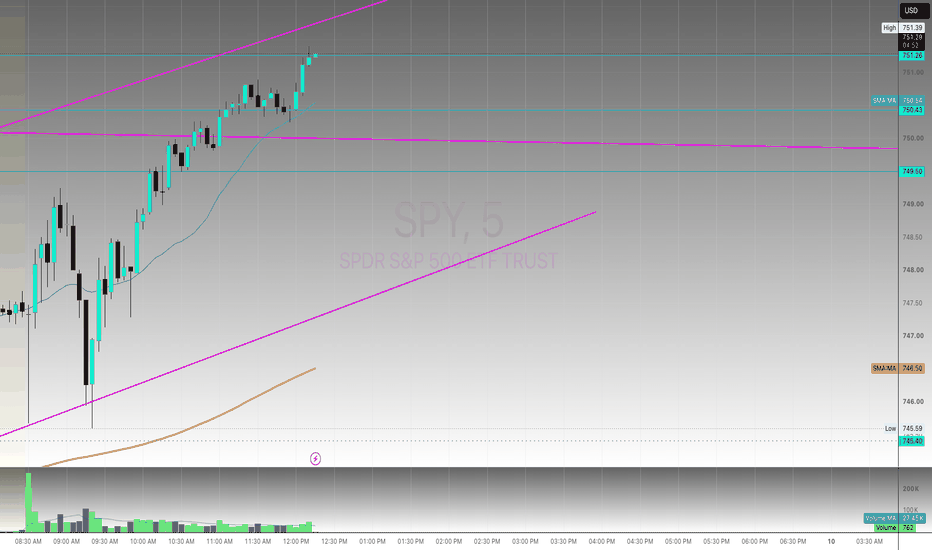
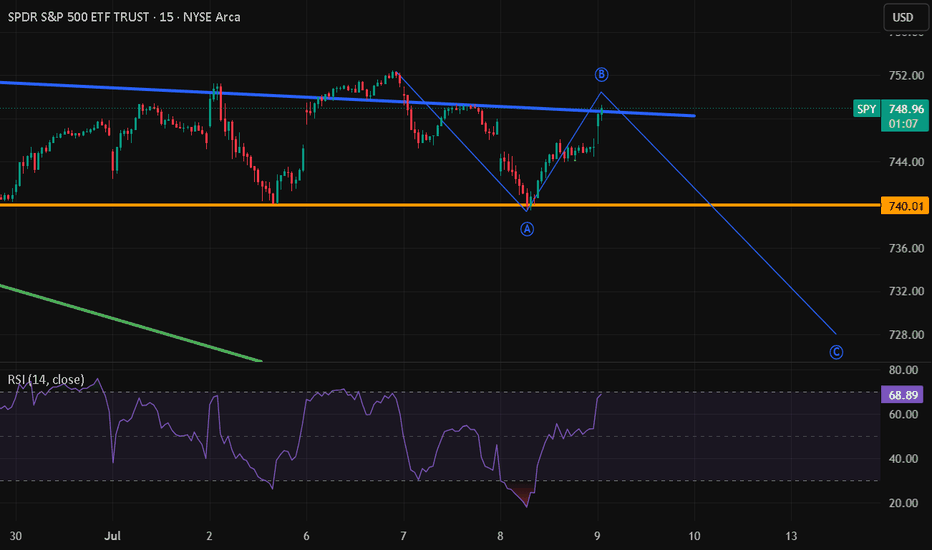
Another ABCThe Market is rallying towards 749-750 in pre market, so it likely gets there by or after open. It looks like another ABC, so at 750 it's a good short entry (with a tight stop). This aligns with the QQQ's getting to their 18ma resistance at 721 and Gap fill area. The Vix will likely test it's breakout at 16.10.
If we drop from here it should be swift and maybe done by early next week.
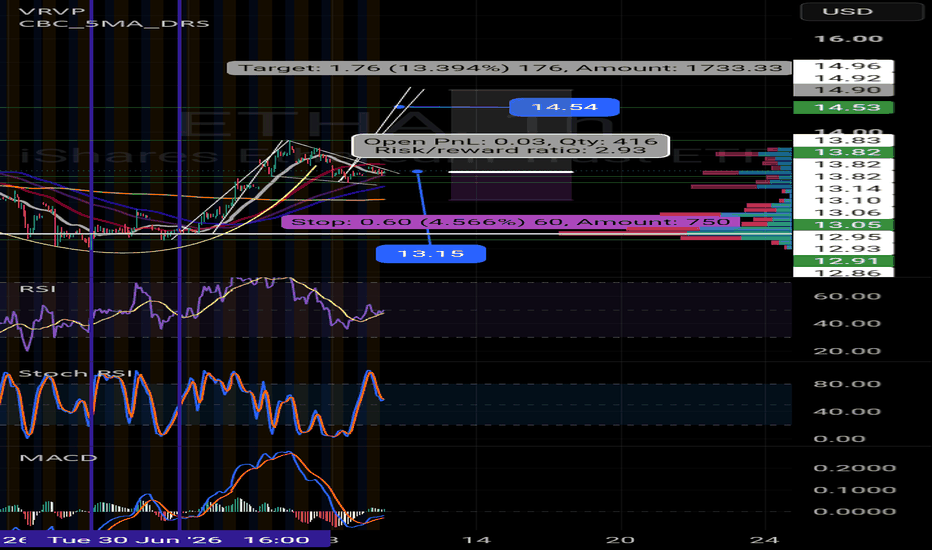
UNG | June, 2026 | The time to go long has come- Timeframe: Weekly
- Trade type: Buy stop order
- Price: 11.83
- Take Profit: Open
- Stop Loss: 11.21 (-5.20 %)
Idea: Long on a breakout above last week's high - bullish momentum continuation.
Entry: Buy stop above last week’s high.
Stop-loss: Below the low of the same candle.
If the weekly candle closes below this level, the trade is invalidated.
Take Profit: Trailing stop following the lows of new weekly candles.
SPY Outlook heading into Monday SPY is once again sitting at a key inflection point, trading between well-defined support and resistance after several sessions of back-and-forth price action. The three paths on the chart aren't predictions—they're simply the scenarios I think are most likely to play out over the next couple of trading days.
🟢 Bullish Scenario
If buyers defend the 743.45-740.50 support zone and reclaim 748.32, momentum could build quickly toward 751.31 and potentially challenge the upper trendline. The structure still allows for a strong relief rally, especially if the market shrugs off the recent weakness and rotates back into large-cap tech.
🔴 Bearish Scenario
The bearish case becomes stronger if SPY loses the lower support zone with conviction. One thing worth watching is META. A significant selloff in META, combined with broader weakness across the major indices, could easily spill over into SPY and accelerate downside momentum. Given META's weight in the market, a sharp move there often influences overall sentiment.
🟡 Range-Bound Scenario
There's also a good chance SPY continues bouncing between these key levels before making a decisive move. Choppy markets have a habit of frustrating both bulls and bears, and until one side gains conviction, we could simply see more consolidation.
My Outlook
Ironically, because so many traders seem to be expecting the bearish outcome, I'm actually leaning slightly bullish for Monday's open. The market has a tendency to move where it causes the most frustration, and with sentiment feeling cautious after the recent weakness, I wouldn't be surprised to see an early squeeze higher before the next meaningful move develops.
That doesn't mean the bullish path is guaranteed—far from it. If META or the broader market breaks down with conviction, this thesis can change quickly. For now, though, I think it's worth keeping an open mind instead of assuming Friday's weakness automatically carries into Monday.
As always, the Heavy Diligence Options Signals Indicator is what I'll be relying on for actual entries. The indicator is built for short-term trading on the 5- and 15-minute timeframes, while these scenarios simply provide context for where price is likely to react. Having the roadmap ahead of time makes it much easier to execute the plan when a quality Call or Put signal appears.
Disclaimer: This is only a trade idea based on the current technical structure and is not financial advice. Always do your own research, wait for confirmation, and manage your risk before entering any trade.
Research 09.07.2026🌏 Markets:
AMEX:SPY +1.91 0.26%(pre/m)
NASDAQ:QQQ +6.21 0.87%(pre/m)
🆕 Economic News:
08:30 USA – Initial/Continuing Jobless Claims
10:00 USA – Existing Home Sales
📈 Gap Ups
Reaction to earnings/guidance:
NYSE:ASX - announces Monthly Net Revenues
Other news:
NASDAQ:AEHR Receives Follow-On Production Order from Lead Silicon Photonics Customer for Fully Automated FOX-XP Wafer-Level Burn-In System
NASDAQ:ALNY and NASDAQ:BBIO soars on NYSE:AZN late-stage trial failure
NASDAQ:CBRS accelerates European Expansion with 200MW of AI Compute Capacity by End of 2027
NASDAQ:AAPL and NASDAQ:AVGO are partnering on a $30 billion AI chip deal.
U.S. chip stocks rebound, tracking China semiconductor rally : NASDAQ:MRVL NASDAQ:ACMR NASDAQ:MXL NASDAQ:AXTI NASDAQ:AMKR NASDAQ:MU NASDAQ:KLAC NASDAQ:LRCX NASDAQ:AMAT NASDAQ:AMD NASDAQ:ASML
China plans to allow leading AI companies to buy a limited number of Nvidia NASDAQ:NVDA H200 chips — The Information.
📉 Gap Downs
Reaction to earnings/guidance:
NYSE:LEVI NASDAQ:PEP
Other news:
NYSE:AZN and NASDAQ:IONS announced a late-stage trial failure, denting the commercial prospects for its gene silencing drug.
TSX:MDA Announces Bought Deal Offering of 20,000,000 Common Shares at a price of US$35.60
Software stocks slide as NASDAQ:SBUX builds AI tools to replace vendor software NYSE:IBM NYSE:NOW NASDAQ:MSFT NYSE:CRM NYSE:NOW
NASDAQ:PSKY Delays NASDAQ:WBD Acquisition Closing as Oregon Review Continues
‼️ Additional
Minutes from the previous FOMC meeting:
-- Most Fed members supported keeping rates at the current level in June.
-- Some Fed members saw grounds for raising rates.
-- Most Fed members preferred not to repeat wording from previous statements that pointed to monetary policy easing.
-- Under current conditions, almost all participants indicated that some monetary policy tightening will most likely be needed.
-- Many support the Fed’s new innovative approach.
-- Most support shortening the FOMC statement.
-- Most believe that the current high inflation could affect expectations.
-- Inflation may remain elevated due to strong AI demand and, accordingly, higher prices.
IRAN SUSPENDS TALKS WITH THE US ON A FINAL SETTLEMENT.
-- CENTCOM CONFIRMED STRIKES ON IRAN IN THE HORMUZ AREA.
-- The US does not rule out that the exchange of strikes with Iran could drag on for several weeks — Axios.
Trump said Spain agreed to pay more after the threat of a trade embargo.
📋 List of tickers involved:
NASDAQ:PENG NYSE:UMC NYSE:BABA NASDAQ:KC NASDAQ:BIDU NASDAQ:JD NASDAQ:PDD NYSE:VG NYSE:OXY NYSE:PBR AMEX:USO NYSE:SHEL NYSE:BP NASDAQ:FCEL NYSE:WOLF NASDAQ:NVTS NASDAQ:MU NASDAQ:SNDK NASDAQ:WDC NYSE:HMY NYSE:AU NYSE:DB NASDAQ:NBIS NYSE:RIO NYSE:STLA XETR:SAP
Best regards – hi2morrow team.
SPY Reclaimed The Shelf But The Short Book Is Full.SPY Reclaimed The Shelf But The Short Book Is Full.
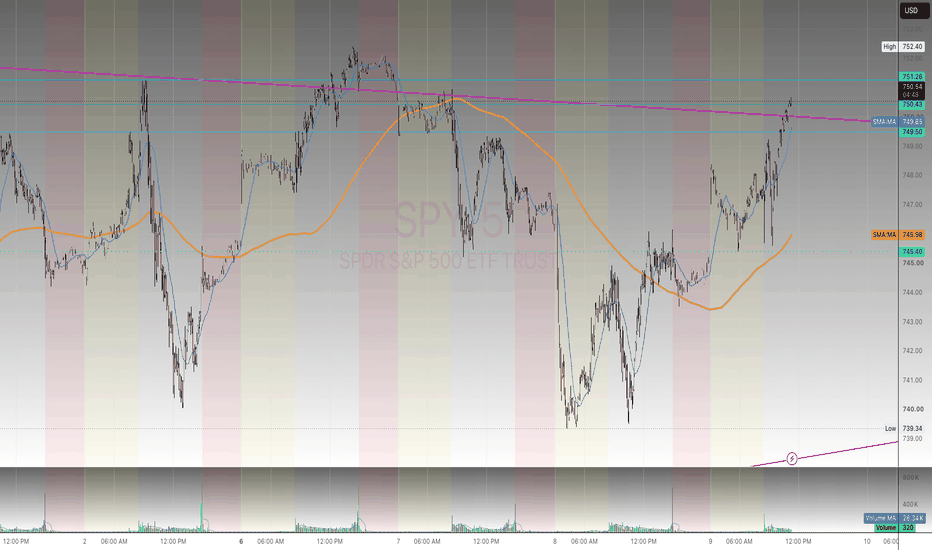
SPY held the 740.44 shelf and recovered to 746, turning the failed breakout into a shakeout so far. The months-long bull anchor even healed the crack it had been carrying. But underneath, the setup is turning top-heavy: the downside conditions are now fully loaded for the first time, an unsustainable-upside flag just tripped, and the near-term conviction is reading deeply bearish right as price sits near the highs. Price recovered; the machinery is leaning the other way.
Resistance: 748-752.40 - the band and the failed high
Key resistance: 752.40 - the cycle high area
Current price: 746.26
Support: 740.44 - the shelf that held
Key support: 736.50-732.45 - the recovery base
Structural floor: 716.50 - the operative low this cycle
Two paths from here:
The shakeout completes. 740.44 held and the bull anchor healed its anti-signal, so a push through 748 back toward 752 would confirm the failed breakout as a shakeout and put the highs back in play. The anchor that would not break all week is standing, and price is holding the upper half of the range.
The top-heavy read resolves down. The downside conditions are loaded at their max for the first time, euphoria is flagged on the recovery, and the hourly conviction is reading near its floor with price up here - a divergence. A loss of 740.44 opens 736.50 then the 732.45 base, and that is where the standing bull anchor finally gets its real test.
The shakeout read is holding and the bull anchor healed - but the short book is now full, euphoria is flagged, and conviction is diverging bearish at the highs. Price near resistance with the machinery loaded short is the setup that resolves fast when it goes. 740.44 held once; whether it holds the next test is the tell.
Built with SYNTHESIS v3.3 | SOM / ACE / IMP / SYNTHESIS
Study, not financial advice.
ARKG | June, 2026 | Continued growth ETF- Timeframe: Weekly
- Trade type: Buy stop order
- Price: 36.96
- Take Profit: Open
- Stop Loss: 34.33 (-7.10 %)
Idea: Long on a breakout above last week's high - bullish momentum continuation.
Entry: Buy stop above last week’s high.
Stop-loss: Below the low of the same candle.
If the weekly candle closes below this level, the trade is invalidated.
Take Profit: Trailing stop following the lows of new weekly candles.
TNA | June, 2026 | Continued stock growth- Timeframe: Weekly
- Trade type: Buy stop order
- Price: 73.69
- Take Profit: Open
- Stop Loss: 67.24 (-8.80 %)
Idea: Long on a breakout above last week's high - bullish momentum continuation.
Entry: Buy stop above last week’s high.
Stop-loss: Below the low of the same candle.
If the weekly candle closes below this level, the trade is invalidated.
Take Profit: Trailing stop following the lows of new weekly candles.
Is the QQQ in the top of the tunnel, or actually in the bottom?Contrary to the common warnings we are very high in the Nasdaq100 and it's time for a correction, I think that the Nasdaq100, due to the AI explosion has gone over the usual tunnel it's been going in for a while, and broke through to create a higher tunnel as the AI is getting so much money that it elevates the whole index. Possible?
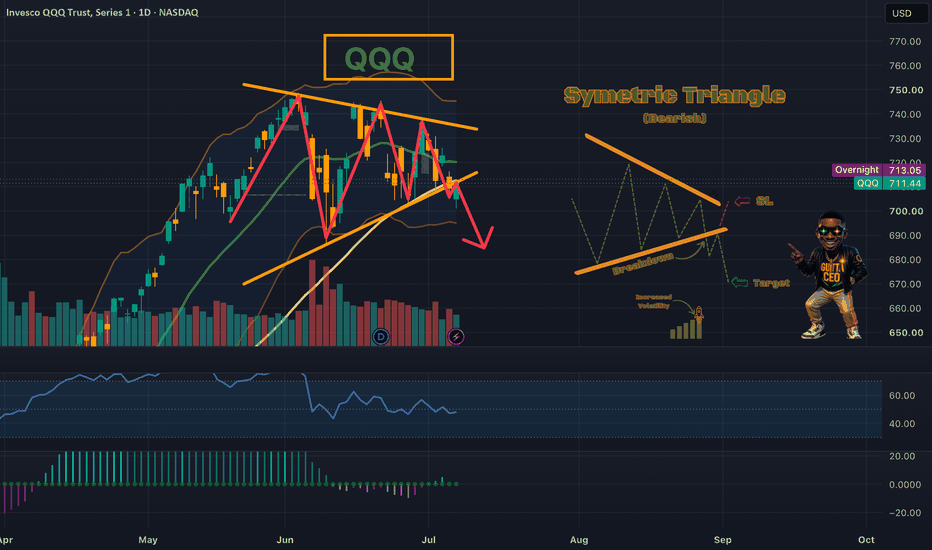
QQQ Bearish Symmetric Triangle – Breakdown Setup with Increased NASDAQ:QQQ is forming a Bearish Symmetric Triangle on the daily chart after a series of lower highs and higher lows.
Key observations:
• Price is coiling inside the converging trendlines with decreasing volume
• A breakdown below the lower trendline would confirm the pattern and open the door for a measured move lower
• RSI is showing signs of weakening momentum
• TTM Squeeze is compressed, suggesting a volatility expansion is likely once the triangle resolves
This is a classic continuation pattern in a broader uptrend that has now stalled. A decisive breakdown increases the probability of a deeper pullback toward the $680–$690 zone.
Trade Plan:
• Breakdown Trigger: Daily close below the lower trendline
• Stop Loss: Above the upper trendline or recent swing high
• Target: Measured move from the triangle height projected lower
Watching closely for confirmation. High-probability breakdown setup developing on QQQ.
#QQQ #SymmetricTriangle #TechnicalAnalysis #BreakdownSetup
nail 3xthis was shown to me originally in a discord, never got their name, but
after looking at the chart
I did some back testing, and it looks like we will go long soon.
on inverted chart target was hit at 30.00, but it's not too late to the party.
in fact, it could just be getting started.
we already seen over 80% gains since 30.00; however, it looks like we came back to test a support.
and we can go up from 40 no conformation yet, if we don't bounce, I can see
35