 Long
Long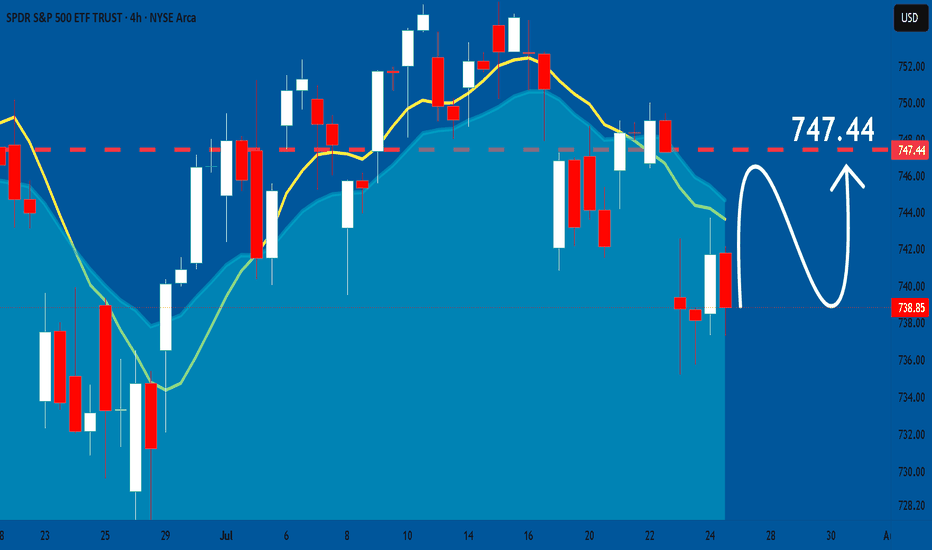
 Long
Long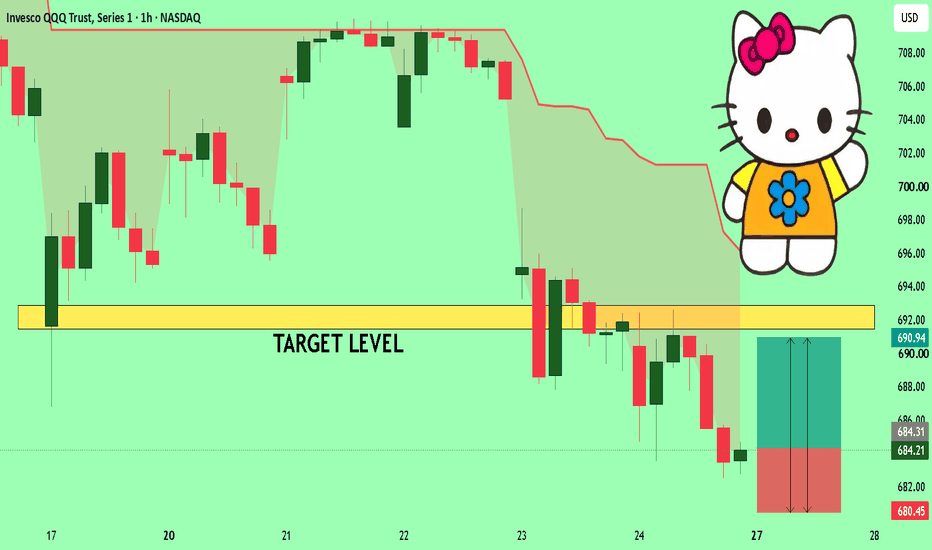
Premium Selling for the Week of 7/27: EWY, SMH, MU, INTCETF's with >50% IVR/>35% IV:
SMH (94.8/62.1), Sept 4th 560 short straddle paying 85.50, 15.3% as a function of strike price.
EEM (83.7/38.4), Sept 4th 63 short straddle paying 5.68, 9.0% as a function of strike price.
XLK (82.2/37.0), Sept 4th 176 short straddle paying 16.77, 9.5% as a function of strike price.
EWT (79.8/41.8), Sept 18th 100 short straddle (no weeklies in this underlying), 11.95, 12.0% as a function of strike price.
TAN (78.0/46.8), Sept 18th 51 short straddle (no weeklies), 7.15, 14.0% as a function of strike price.
EWY (72.7/74.9), Sept 4th 163 short straddle, 30.35, 18.6% as a function of strike price.
Single Name with >70% IVR/>50% IV Without An Earnings Announcement in the Next 45 Days:
MU (82.2/102.8) (Probs announces in late Sept; last announcement was 6/24), Sept 4th 920 short straddle, 233.57, 25.4% as a function of strike price.
INTC (72.4/87.4) (Announced Last Week), Sept 4th 92 short straddle, 20.98, 22.8% as a function of strike price.
I'm generally not going to do short straddles in these, but if the short straddle isn't paying at least 10% of the strike price in credit, then a standard setup (i.e., 45 DTE, 25 delta short strangle both sides) isn't probably going to pay either; the price-out of the short straddle is basically a "starting point" to see which underlyings offer the best bang for my buying power buck ... .
It looks like EWY, followed by SMH offer the best bang for buck, with TAN and EWT being kind of illiquid and XLK (which is kind of just QQQ "lite") and EEM, not making the 10% cut-off. Both INTC and MU are "bang for my buck" worthy.
Preliminary Setups:
EWY Sept 4th 140/195 short strangle, 11.85 credit, -1.94/28.68 delta/theta.
EWY Sept 4th 125/140/195/210 iron condor, 5.78 credit, .46/7.58 delta/theta.
SMH Sept 4th 500/645 short strangle, 33.17 credit, .76/82.18 delta/theta.
SMH Sept 4th 445/600/645/700 iron condor, 19.69 credit, .08/29.01 delta/theta.
MU Sept 4th 770/1180 short strangle, 90.02 at the mid, delta/theta -.08/224.06.
MU Sept 4th 670/770/1180/1280 iron condor, 39.35 at the mid, delta/theta 3.36/50.13.
INTC Sept 4th 80/115 short strangle, 8.51 credit, .43/20.12 delta/theta.
INTC Sept 4th 70/80/115/125 iron condor, 4.09 credit, delta/theta 4.82/5.17.
QqqIf we gap down Monday then it's 680 gap close and below 680, then 674 comes..
If we don't gap down Monday I expect a grind from Monday- we'd back up to 702-706 and from there we head down in to 674 which is
.618 fib and weekly 20sma..
Most of this sell should come from chips late in the week but let's look at some tech sectors..
Starting with AMEX:XLC , The home of googl and meta
Almost near supply area of 103.. has been trading 103 -120 for over a year now and imo it is distribution. I'm looking at this chart and from what I see is, if we break below 103, we are headed back to tariffs lows.
Unless we close below 103 this week I'd be cautious shorting down here .
AMEX:XLY home of TSLA and Amzn
Too far outside it's daily Bbands.. but the short isn't done. I think we pop higher early in the week then we head to 104 either this week or early next week. As you can see this sector has traded sideways similar to XLC for an entire year.. similar to XLC if XLY holds 104 then a rally can come , but if it loses 104 then we take tariff lows
CBOE:IGV software sector NYSE:ORCL and NASDAQ:MSFT
I actually had I hopes for this sector
Bounced Friday off it's weekly 200ema, but the selling isn't done, I expect a drop to 84 this week to complete this double top. From there we'll see what happens
Lastly
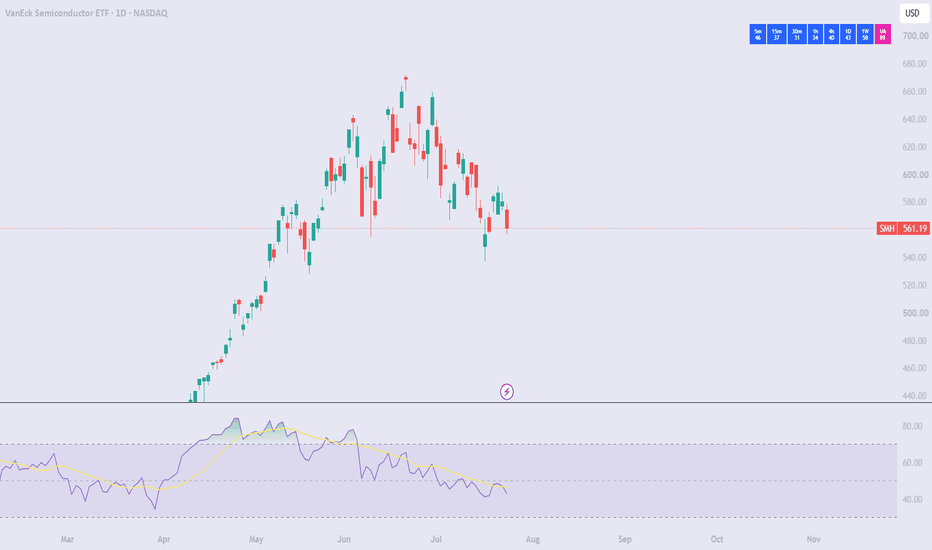
NASDAQ:SMH chips..
My target this week is the weekly 20sma or 522 gap close
Simple down trend here , with stiff resistance at 572..
So to put it all together, most of the mag 7 and software sectors I see them dropping another 2-4%.. From those crucial supports we either have a big rally going into early August or crash back to COVID lows. the major problem is the monthly candle, if we end up closing below 690 for the month then the bearish dragon fly doji for June is a confirmed reversal which means even if we rally early August we most likely start selling back down around mid August to keep in line with the monthly trend. Short 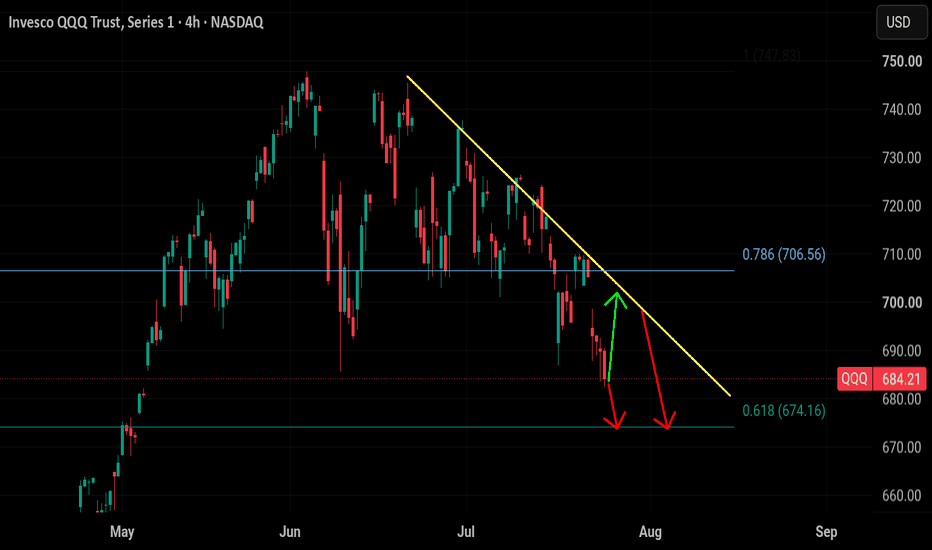
Short 
Stock Market Forecast | BTC TSLA NVDA AAPL AMZN META MSFT0:00 - Intro & Video Overview
0:17 - Macro Data & Sector Rotation
1:05 - AI Sentiment Data & Fear Index
1:51 - Earnings Preview: CapEx Fear vs. Semi Impact
3:16 - Semiconductor ( NASDAQ:SMH ) Dark Pool Analysis
5:01 - Upcoming Economic Data (FOMC, PCE, PMI)
5:25 - S&P 500 ( AMEX:SPY ) Technical Breakdown
6:53 - Nasdaq 100 ( NASDAQ:QQQ ) Weakness & Sector Weighting
8:29 - Bitcoin ( CRYPTOCAP:BTC ) Technical Analysis & Key Levels
10:11 - Tesla ( NASDAQ:TSLA ) Earnings Reaction & Support Zones
13:04 - Meta ( NASDAQ:META ) Outlook Ahead of Earnings
13:56 - Amazon ( NASDAQ:AMZN ) Support & CapEx Concerns
14:37 - Microsoft ( NASDAQ:MSFT ) Chart Setup
16:21 - Google ( NASDAQ:GOOGL ) Post-Earnings Pullback
17:38 - Apple ( NASDAQ:AAPL ) Price Discovery & Strength
18:27 - Nvidia ( NASDAQ:NVDA ) Key Support & Structure
19:42 - Outro & Upcoming Commodities Update
YouTube Video DescriptionIn this weekly stock market update, we break down the macro implications of rising AI CapEx fears following Google’s earnings, NASDAQ:SMH dark pool prints, and key technical levels across the S&P 500, QQQ, Bitcoin, and the Mag 7.Key Technical Levels & Macro Drivers:CapEx Anxieties & Earnings Week: Google's earnings spooked markets over escalating AI CapEx spend.
All eyes are on Apple, Amazon, Microsoft, and Meta earnings to see if CapEx continues to rise (bullish for semis, bearish for mega-cap tech) or plateaus.Semiconductors ( NASDAQ:SMH ): Dark pool prints came in at Friday's low near $560 (the 3rd largest print), defending the last structural floor. Bulls need to reclaim $605–$620 to target a backtest of the $633 breakdown zone.
Indices Divergence ( AMEX:SPY vs NASDAQ:QQQ ): SPY remains resilient just 3% off all-time highs thanks to healthcare, energy, and financial sector rotation. QQQ broken down due to heavy semi weightings.
Bitcoin ( CRYPTOCAP:BTC ): Flashing relative strength against tech, forming a potential inverse head-and-shoulders. Reclaiming $67K negates a bear flag and unlocks a run toward $70K.Mag 7 Highlights:
NASDAQ:TSLA : Gapped down post-earnings into lower structural support; waiting for weekly oversold conditions near $334/teen RSI readings for high-probability bounce setups.
NASDAQ:AAPL : The standout leader insulation from AI CapEx spending fears, trading in pure, uninterrupted price discovery mode at all-time highs.
NASDAQ:NVDA : Fiercely defending its $200 historical resistance-turned-support floor. Zero macro structural damage while holding above this level.
NASDAQ:MSFT & NASDAQ:GOOGL : Microsoft holding $380 support after taking its CapEx hit last earnings; Google testing key support near $311 with a psychological floor at $300.
Long 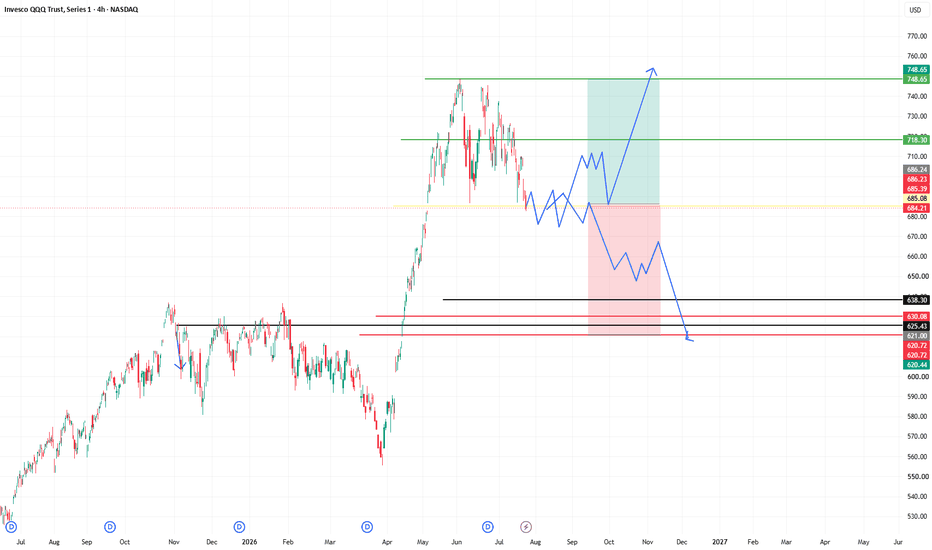
Short 
Short 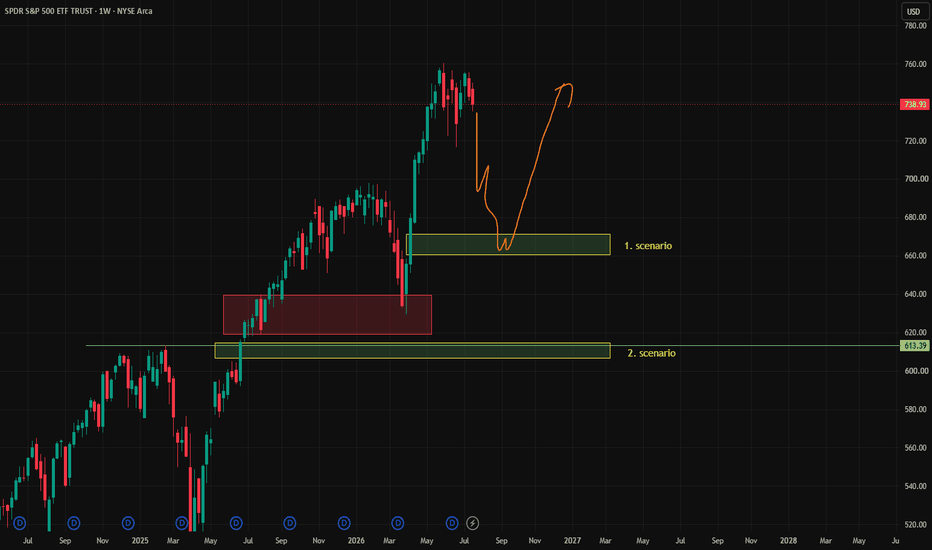
 Education
 Short
Short
Short 
Long 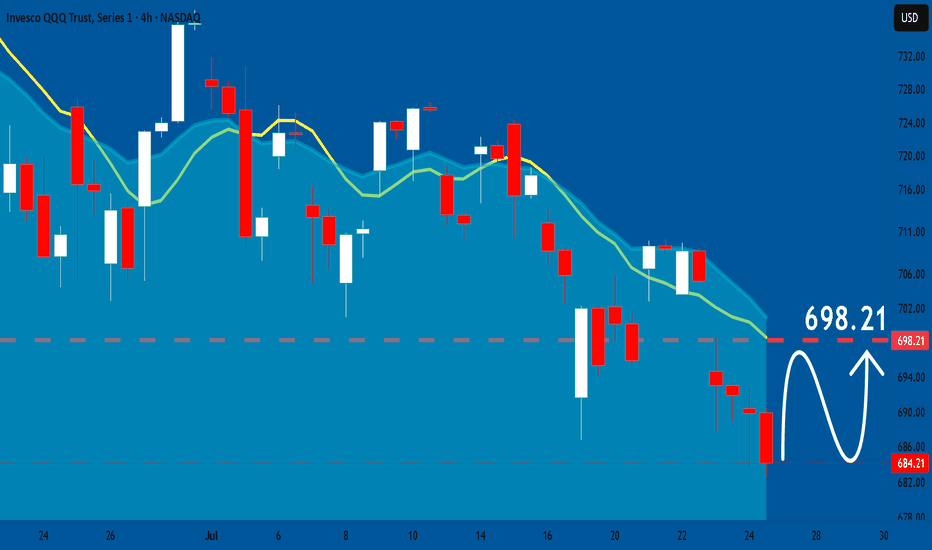
Long 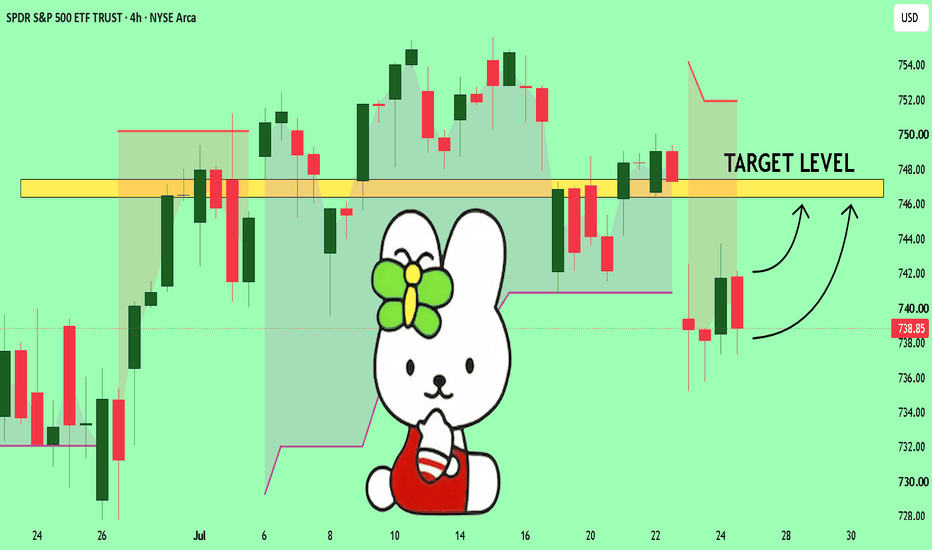
Short 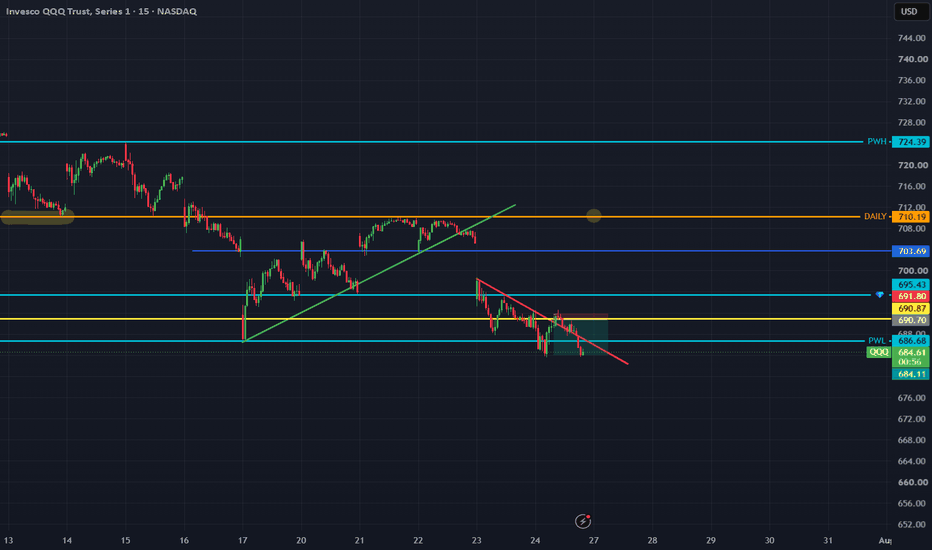
SPY Interval Delta-Hedged Iron Condor (Update)This is a continuation of an iron condor post where I'm basically delta hedging at intervals additively, subtractively, or via rolling. (See Post Below).
An additive delta hedge adds a spread to reduce net delta in one direction or the other. If the net position is skewing short, a short put spread is added; long, a short call spread.
A subtractive delta hedge takes profit on a spread to reduce delta in the position. If the net position is skewing short, I look to close a short call spread (assuming it can be done for 50% max) or greater; long, I look to close a short put spread (again, assuming it can be done at 50% max or greater).
I can also do an adjustment "non-additively" by just rolling in the untested side toward current price if I don't want to add units and the DTE is of sufficient duration. I generally don't roll in a side unless there are greater than 28 DTE left, particularly in this market, which has been somewhat whippy.
I also look at whether I can profitably mix and match put spread with call spread to reduce units, looking to close out for around a 1.40 ($140) profit, since the vast majority of the double double iron condors I put on that are ten wide on the put side with the short put leg at the 25 delta and the 2 x 5 wide with the short call leg at the -13 delta pay in the neighborhood of 2.80 ($280) per contract.
Generally, I only want to look at doing adjustments once a week, and only want to consider doing one additively if the net delta of the position is >+/- 5 delta, since a 45 DTE 10-wide spread on the put side with the short leg at the 25 delta only gives you about that amount, as does a 2 x 5 wide on the call side, with the short call legs camped out at the -13.
Currently, the net position is kind of spaghetti-works of spreads in the July 31st, August 7th, and August 21st contracts with 23.70 total credits collected on a capital requirement of 50.00, and a delta/theta of -13.23/28.80.
If I get time, I'll post all the individual spreads that are currently in the hopper ... .
AALG LONG — 1D ALMA Setup (WR 83% · avg RR 4.2)█ SETUP
NASDAQ:AALG · 1D · long only.
(Context: Leverage Shares 2x Long AAL Daily ETF — 200% daily exposure to American Airlines Group; path-dependent vs holding AAL outright.)
ALMA Averaging Strategy: ALMA 3 / σ2, SD band 2, min diff 1/1, 25% per bar, up to 4 adds, hard stop −10% from average entry.
Strategy Tester (AALG 1D):
Win rate 83% · profit factor 8.9 · max drawdown 9%
Avg winning trade +29.3% · avg losing trade −7.0%
Typical hold ~17×1D bars on winners — 2x airline mean-reversion grid on the daily Averaging template · 41-trade sample
═
█ WHY NOW
Fresh 1D ALMA long on the 21 Jul 13:30 UTC bar ~ $14.50 — first lot on this Averaging template (1 of 4).
Bar-close ENTRY after the mid-Jul wash under ~$16 — not a discretionary “buy American Airlines” call and not a leveraged day-trade. Hard stop −10% from fill ~ $13.05 . Exits follow Pine ALMA flip + min diff or the hard stop. Scale-in stays 25% per bar, up to 4 adds, if lower bars qualify.
═
█ MACRO
Sector: AALG = daily 2x AAL beta — US airline demand, unit revenue, fuel/cost gap vs peers, and leisure/corporate traffic drive the underlying more than broad index beta. Leverage and daily reset mean multi-day holds diverge from 2× spot AAL.
Tape (19–21 Jul): American Airlines CEO outlined a plan to close a >$3B profit gap (19 Jul), while peer airline headlines stayed on fuel costs and capacity fights (JetBlue/Spirit slots, Ryanair industry-shakeout talk). Execution is 1D ALMA Averaging on the fill bar — not an AAL earnings or CEO-vision forecast.
═
█ OUTLOOK
Positive factors
- Tester skew: 83% WR · PF 8.9 · avg win +29.3% vs avg loss −7.0% — fat right tail vs bounded ALMA stop path
- Fresh first-lot ENTRY on the 21 Jul daily close ~$14.50 after the mid-Jul slide from the mid-$15s — process re-arm, not revenge size
- ALMA — daily just flipped LONG at the band: 1D L:1 vs LAvg:4.3 — first bar above ALMA / SuperTrend pocket (~14.14–14.17) — touch-quality long, not a late chase deep above the band
- ALMA — slow clocks still stretched SHORT below: 3D S:4 vs SAvg:3.9 (OVERHEAT-S) · 1W S:3 vs SAvg:3.1 — structure clocks still below the band while the daily template arms — classic HTF discount fuel for an Averaging long
- EMA — weekly/3D still Below: 3D Cur S:4 · 1W Cur S:3 with weekly Dev still large in magnitude — slow EMA side not reclaimed; room for mean-revert if daily holds the flip
- SMC — 1D: FVG Enter Bull tagged ~ $14.17 on the 20 Jul daily bar — demand inefficiency sits just under the fill
Negative factors
- EMA — LTF already Above: 15m Cur L:6 · 1H Cur L:2 · 4H Cur L:3 · 1D Cur L:1 — young above-session on the execution clock; not a deep below-EMA discount entry
- SMC mixed at ~$14.17: same window also printed FVG New Bear — bull FVG is not a clean one-way shelf
- 2x daily leveraged ETF — overnight gaps and chop in AAL can erase a “correct” multi-day AAL view via compounding / path dependency even if the underlying drifts the right way
- First lot only (1 of 4) — no averaged cushion yet if the daily bar fails and lower adds qualify or the −10% path prints first
- Snapshot board had no VWAP Touch row for AALG — no Active Support/Resistance levels to lean on in this idea
Takeaway: the 1D ALMA strategy and strong tester skew support a disciplined first lot after the mid-Jul wash, with 3D/1W still below-band and a bull FVG near ~$14.17, but LTF OVERHEAT-L, a young daily above-session, mixed FVG, and 2x path risk frame a repair grind — not a clean trend reclaim; nominal risk stays on the −10% hard stop / Pine exit path.
Base case: follow 1D ALMA Averaging · hold/add on qualifying bars while the ~$14.1–14.5 bull-FVG / ALMA pocket cushions · mean-revert toward the mid-$15s prior shelf if AAL tape stabilizes without a fresh gap through the stop.
Bear case: lose the ~$14.17 bull FVG · 15m/1H giveback extends · AAL headline gap drives AALG through −10% toward ~$13.05 from this fill · template posts the stop and waits for the next bar-close arm.
Chart: NASDAQ:AALG 1D — ALMA Averaging Strategy.
Educational idea. Live position — past backtest ≠ future results. NFA.  Long
Long
Bubble Form Your Shell, The Paradox, Learn From Our Past & Elon Our Universe Expands Like a Bubble, Solidifying Mass Along the Way. Why Shouldn't a Financial Bubble Be Allowed to Do the Same?
Popping a bubble is interfering with someone's business plan. Of course it will fail after that. Then comes the "I told you so" paradox: a purely self-creating feedback loop that feeds fear, causes the very thing people predicted, and then provides false confirmation that validates the bias further. The prophecy doesn't prove itself. It creates itself.
This is why borrowing is so expensive. Because every idea has to survive a renewal cycle of reassessment as it travels an evolutionary path. The origin of any plan may not be as valid as the rethink. The pivot. The new direction. That's not failure, that's iteration. That's how every successful venture in human history has worked.
But instead of allowing that evolution, we fold. "This happened, therefore it's over." How about: we set out to do this, we found this instead, we reassessed, here's the new narrative. Don't mistake iteration for taking the piss. Dive into the mechanics. Examine the timeline. Map each trajectory. Adjust. That's what intelligent capital does.
Panic is the enemy. Not risk. Not even mistakes.
Bring enough wealth into the system to allow mistakes to be made, survived, and learned from. Sanction repeated identical failures if necessary. But do not penalise the evolutionary process itself. Do not pop the forming bubble just because it looks unfamiliar. Otherwise the initial investment, the original belief, the first deployment of capital, becomes nothing more than another entry in the Economic Death Wedge.
We lost a decade last time. Ten years of compounding, innovation, livelihoods, and progress. Because someone panicked. Because someone said "I told you so." Because we confused iteration with failure and pulled the plug on ourselves.
Never again.
The bubble is the mechanism. Let it solidify. Let it evolve. Let it do what the universe does: expand, create mass, and keep going.
I dare us to break the cycle.
Cube Cosmos
Research 24.07.2026🌏 Markets:
AMEX:SPY +2.54 0.34%(pre/m)
NASDAQ:QQQ +2.06 0.30%(pre/m)
🆕 Economic News:
THE US WILL IMPOSE NEW TARIFFS OF 10% TO 12.5% ON 60 COUNTRIES STARTING FRIDAY.
08:00 USA – Building Permits
10:00 USA – New Home Sales
📈 Gap Ups
Reaction to earnings/guidance:
NASDAQ:INTC NASDAQ:AMKR NYSE:THC NYSE:WKC NYSE:EW GPW:ASB XETR:SAP NYSE:SLB NYSE:DLR NYSE:NEM NYSE:CNI NYSE:SXT
Other news:
NASDAQ:NKTR on Start of Phase III Program on Rezpeg for Atopic Dermatitis
NASDAQ:ESLT Wins More Than $370 Million in CBP Contracts Through 2029
NYSE:ORCL wins $7 billion Pentagon software contract
NASDAQ:ADVB surging after the company terminated a purchase agreement giving it the right to issue and sell up to $25 million worth of stock to Helena Global Investment Opportunities I.
📉 Gap Downs
Reaction to earnings/guidance:
NASDAQ:MXL NASDAQ:SMMT NASDAQ:CHTR NYSE:HIG NYSE:DECK NYSE:AXP NYSE:NEE NYSE:VZ
Other news:
NASDAQ:ZVRA Provides Update on Regulatory Submission for Arimoclomol for the Treatment of Niemann-Pick Disease Type C (NPC) in the European Union
NASDAQ:RADX Announces Concurrent US$4.1 Million Registered Direct Offering
NASDAQ:WSE : US regulator rejects banking licence application
‼️ Additional
THE US WILL IMPOSE NEW TARIFFS OF 10% TO 12.5% ON 60 COUNTRIES STARTING FRIDAY.
-- The new measures are being justified as part of efforts to combat forced labor. A 10% tariff will be imposed on countries that have committed to adopting and enforcing a ban on imports of goods produced using forced labor. Other countries will face a 12.5% tariff.
-- The new tariffs will effectively replace the temporary global duties on US imports that took effect on February 24 for a period of 150 days.
-- In total, the measures will affect 99.4% of US imports and will apply to Washington’s largest trading partners — The Hill.
Trump: Xi Jinping is coming on September 24.
The Magnificent Seven stocks saw their sharpest one-day selloff since April 2025 yesterday.
-- Hedge funds and asset managers are actively selling US Big Tech stocks, while short positions in Nasdaq futures are rising rapidly, according to EPFR data.
🏢 IPO
NASDAQ:SCTX – Scribe Therapeutics, Inc.
Company develops CRISPR-based therapies for cardiovascular and metabolic diseases. Lead program, STX-1150, is designed to lower LDL cholesterol by targeting PCSK9 without permanently changing DNA. The company also has programs for elevated Lp(a) and severe triglycerides. Core thesis is one-time or long-lasting genetic medicine for major heart disease risk factors.
Price: $15.00
Shares: 8.6M
Raised: $128.7M
Concurrent Private Placement: $7.5M
Market Cap: ~$256.2M
LTM:
Revenue: $36.3M
Net Income: -$35.7M
Key point:
Lead program is in first-in-human Phase 1 trial, with initial data expected in H1 2027.
Comparable public companies: NASDAQ:CRSP , NASDAQ:NTLA , NASDAQ:BEAM , AQUISEU:VERV , NASDAQ:EDIT , NASDAQ:PRME
📋 List of tickers involved:
NASDAQ:INTC NASDAQ:AMKR NYSE:THC NYSE:WKC NYSE:EW GPW:ASB XETR:SAP NYSE:SLB NYSE:DLR NYSE:NEM NYSE:CNI NYSE:SXT NASDAQ:NKTR NASDAQ:ESLT NYSE:ORCL NASDAQ:ADVB NASDAQ:MXL NASDAQ:SMMT NASDAQ:CHTR NYSE:HIG NYSE:DECK NYSE:AXP NYSE:NEE NYSE:VZ NASDAQ:ZVRA NASDAQ:RADX NASDAQ:WSE NASDAQ:SCTX NASDAQ:CRSP NASDAQ:NTLA NASDAQ:BEAM AQUISEU:VERV NASDAQ:EDIT NASDAQ:PRME
Best regards – hi2morrow team.


