SPY Jun 22: Compression Before Expansion?
SPY enters June 22 trapped inside a tightening range after recovering from the sharp selloff that tested 739 earlier in the week. The 15-minute chart continues to build higher lows while repeatedly stalling beneath the 748-749 resistance zone.
Friday's session formed a classic compression pattern with buyers defending the rising trendline while sellers capped every rally near recent highs. This setup often precedes a larger directional move, and the GEX positioning provides a clear roadmap for where that move could accelerate.
The battle remains centered around 747, which currently acts as both technical support and the primary dealer pivot.
Key Levels
Resistance: 750.00
Resistance: 751.00
Resistance: 752.00
Resistance: 753.00
Major Resistance: 755.00
Support: 747.00 (HVL)
Support: 744.00
Support: 740.00
Major Support: 735.00
GEX Positioning
The most important level for Monday is 747.
This level contains the HVL, major dealer positioning, and serves as the center of current market balance. Price spent most of Friday trading around this area, confirming its importance.
Above current price, positive gamma levels are stacked aggressively at 750, 751, 752, 753 and 755.
The strongest concentration sits between 750 and 752 where C1, C2 and multiple dealer positioning clusters align. If buyers can push SPY above 750, dealer hedging could begin pulling price toward 752 and 753.
Above 753, the final major upside target becomes 755 where another significant positive gamma cluster sits.
Below price, support begins at 744. This level represents the first meaningful downside target if 747 fails.
The next major support zone is 740, which previously acted as a strong reaction low during last week's selloff.
Below 740, the final major downside target becomes 735.
The overall GEX structure remains moderately bullish because SPY is holding directly on top of the HVL while the largest gamma concentrations remain stacked above current price.
Trade Considerations
The 15-minute chart is forming a tightening wedge between rising support and overhead resistance.
Buyers continue stepping in around 746-747 while sellers defend the 748-749 region.
This compression cannot continue indefinitely and should eventually resolve with expansion.
The cleanest setup is watching for either a breakout above 750 or a loss of 747.
Bullish Scenario
A breakout above 750 would place price directly into the strongest positive gamma zone.
Dealer hedging flows could accelerate a move toward 752 and 753.
If momentum remains strong, SPY could challenge the major resistance level at 755.
Bearish Scenario
A break below 747 would signal buyers are losing control of the current range.
The first downside target becomes 744.
If 744 fails, expect a move toward 740 where stronger support exists.
A break below 740 would expose 735.
Options Outlook
Above 750:
Calls gain a significant advantage with dealer positioning favoring continuation toward 752-755.
Between 747 and 750:
Expect choppy range-bound trading and frequent reversals.
Below 747:
Puts gain momentum with downside targets at 744 and 740.
Bullish Targets
750.00
751.00
752.00
753.00
755.00
Bearish Targets
747.00
744.00
740.00
735.00
Conclusion
SPY enters June 22 sitting directly on its most important level at 747. The 15-minute chart continues to compress while GEX positioning favors upside expansion if buyers can reclaim 750. Above 750, dealer hedging could fuel a move toward 752, 753 and potentially 755. Below 747, the focus shifts toward 744 and 740. Monday's battle zone is clearly defined between 747 and 750, with a breakout from that range likely determining the next directional move.  Short
Short
QQQ / NDX Weekly Outlook – Week 24 of 2026 (15-18 JUN)Important notice: My previous SPY and QQQ content since 2025 has been removed due to a TradingView house rules violation. This included my regular weekly outlooks and mid week market updates. I have been consistently publishing structured SPY and QQQ market analysis, and I will now rebuild this track record with daily posts going forward.
QQQ/NDX Weekly Outlook
Last Week's Recap
We found a strong bounce from Key Level 1 at 696.5 on Tuesday exactly as expected. However, with the CPI report scheduled for Wednesday, patience was required and no position was taken immediately.
On Wednesday, the cooler than expected CPI report removed the primary macro concern. Following the original Long Scenario 1 plan, we entered long positions at the market open. Shortly afterward, renewed US-Iran conflict headlines and aggressive rhetoric from President Trump triggered a sharp market selloff.
Despite the volatility, price never invalidated the setup because the daily candle never closed below the lower boundary of Key Level 1. As a result, the trade remained active.
On Thursday, ceasefire headlines began circulating and the market started to deliver the exact reaction we had been expecting. Together with the group, we took partial profits at our predefined targets:
706 → 715 → 723
The trade was executed exactly according to plan.
1 trade taken.
1 trade closed green.
UA CAPITAL Market Recap
Markets have now completed Week 23, and for us it was another green week.
We are now sitting at 10 consecutive green weeks. Since the beginning of the year, we have not had a single red week. Aside from a few breakeven weeks, every week has finished positive.
Following the heavy selloff caused by the PPI report during the previous week, I explained in this week's Weekly Market Outlook that markets were now waiting for Wednesday's CPI report.
The plan was simple.
If CPI contradicted the inflation concerns created by PPI and came in cooler than expected, while geopolitical tensions remained stable, markets could experience a strong relief rally.
Early in the week, however, renewed military escalation between the US and Iran created significant uncertainty. US airstrikes against Iranian targets triggered another wave of selling pressure.
Price moved directly into the levels identified in the Weekly Market Outlook. SPY tested 732.5 while QQQ tested 696.5. At that point, markets had reached levels where a bullish technical structure could begin forming. The only missing ingredient was a catalyst and CPI had the potential to become that catalyst.
On Wednesday, CPI came in lower than expected and markets initially reacted positively during premarket trading.
The original plan already contained a clean invalidation framework using daily closes below key levels.
On Thursday, markets reacted strongly after reports suggested that peace negotiations were moving forward again.
Friday delivered an even stronger continuation move and re established the bullish structure I had originally expected.
In reality, the entire weekly thesis played out exactly as anticipated:
Technical demand zone + cooler CPI data + geopolitical de-escalation = strong swing rally.
Once Thursday's reaction confirmed the scenario, I informed premium members that markets could potentially begin exploring new all time highs over the next one to two weeks, assuming geopolitical risks remain contained.
Together with the group, we initiated multiple swing long positions across SPY, QQQ, and several individual names including ARM, AMD, SNDK, MU, and MRVL.
The swing call positions established in ARM, SNDK, and AMD generated substantial gains by Friday.
This Week's Scenarios / Prediction
Risk Index
The Risk Index has shifted back into risk on mode following the strong call flow triggered by peace related headlines.
This oscillator reads macro conditions and converts them into a technical risk framework. It was developed internally at UA CAPITAL and remains the primary indicator I use for both short term and long term positioning decisions.
The Risk Index currently signals the potential for bullish continuation. If geopolitical headlines remain stable and no new negative catalysts emerge, the model suggests that new all time highs remain achievable.
For that reason, we will continue focusing exclusively on swing long opportunities from predefined key levels.
Long Scenarios
We currently have two primary bounce zones.
Long Scenario 1
KEY Level 1 (731): This is the first major support zone where I expect a reaction. If price reaches this area and confirms a bounce, call options can be used to establish long exposure.
Targets:
735.5 → 744 → 748.5 → 750
Runner can be held.
Long Scenario 2
KEY Level 2 (713): This is the second major demand zone. If price reaches this level and confirms support, call options can be used to establish long exposure.
Targets:
721 → 730 → 735.5 → 744 → 748.5 → 750
Premium Tip
Price may temporarily break below these bounce zones, creating the appearance of a failed setup before reclaiming the level and moving higher. Because of this, entries can be considered after an hourly bullish candle close above the zone.
Position Management Rules
1. Entry model: One hourly bullish candle close above the level.
2. Take profits in stages because market reversals can happen quickly.
3. After the first profit target is reached, move all remaining stop losses to breakeven and convert the position into a risk-free trade.
4. A reaction from the level must be confirmed. We do not predict price. We react to price.
5. Daily candle close below the bounce zone = stop loss.
This analysis is for educational purposes only and reflects my personal opinion. It is not financial advice. Long 
SPY / SPX Weekly Outlook – Week 24 of 2026 (15-18 JUN)SPY/SPX Weekly Outlook
Last Week's Recap
We found a clean bounce from Key Level 1 at 732.5 on Tuesday. However, with the CPI report approaching, patience was required, so we did not enter the trade until Wednesday.
Once the cooler than expected CPI data was released on Wednesday, the macro uncertainty around inflation was removed. Following our Long Scenario 1 plan, we entered long positions shortly after the market open.
However, after the US-Iran conflict escalated and additional comments from Trump hit the wires, markets sold off aggressively. Despite the volatility, our invalidation level required a daily close below 725, which never happened. As a result, we stayed in the trade and continued following the original plan.
On Thursday, ceasefire headlines started circulating and the market began delivering exactly the reaction we had anticipated. Together with the group, we took partial profits at our predefined targets of 737 → 740 → 744.
1 trade.
1 win.
UA CAPITAL Market Recap
Markets have now completed Week 23, and for us it was another green week.
We are now sitting at 10 consecutive green weeks. Since the beginning of the year, we have not had a single red week. Aside from a few breakeven weeks, every week has finished positive.
Following the heavy selloff caused by the PPI report during the previous week, I explained in this week's Weekly Market Outlook that markets were now waiting for Wednesday's CPI report.
The plan was simple.
If CPI contradicted the inflation concerns created by PPI and came in cooler than expected, while geopolitical tensions remained stable, markets could experience a strong relief rally.
Early in the week, however, renewed military escalation between the US and Iran created significant uncertainty. US airstrikes against Iranian targets triggered another wave of selling pressure.
Price moved directly into the levels identified in the Weekly Market Outlook. SPY tested 732.5 while QQQ tested 696.5. At that point, markets had reached levels where a bullish technical structure could begin forming. The only missing ingredient was a catalyst and CPI had the potential to become that catalyst.
On Wednesday, CPI came in lower than expected and markets initially reacted positively during premarket trading.
The original plan already contained a clean invalidation framework using daily closes below key levels.
On Thursday, markets reacted strongly after reports suggested that peace negotiations were moving forward again.
Friday delivered an even stronger continuation move and re established the bullish structure I had originally expected.
In reality, the entire weekly thesis played out exactly as anticipated:
Technical demand zone + cooler CPI data + geopolitical de-escalation = strong swing rally.
Once Thursday's reaction confirmed the scenario, I informed premium members that markets could potentially begin exploring new all time highs over the next one to two weeks, assuming geopolitical risks remain contained.
Together with the group, we initiated multiple swing long positions across SPY, QQQ, and several individual names including ARM, AMD, SNDK, MU, and MRVL.
The swing call positions established in ARM, SNDK, and AMD generated substantial gains by Friday.
This Week's Scenarios / Prediction
Risk Index
The Risk Index has shifted back into risk on mode following the strong call flow triggered by peace related headlines.
This oscillator reads macro conditions and converts them into a technical risk framework. It was developed internally at UA CAPITAL and remains the primary indicator I use for both short term and long term positioning decisions.
The Risk Index currently signals the potential for bullish continuation. If geopolitical headlines remain stable and no new negative catalysts emerge, the model suggests that new all time highs remain achievable.
For that reason, we will continue focusing exclusively on swing long opportunities from predefined key levels.
Long Scenarios
We currently have two primary bounce zones.
Long Scenario 1
KEY Level 1 (749.5): This is the first major support zone where I expect a reaction. If price reaches this area and confirms a bounce, call options can be used to establish long exposure.
Targets:
753 → 755.5 → 760
Runner can be held.
Long Scenario 2
KEY Level 2 (737.5): This is the second major demand zone. If price reaches this level and confirms support, call options can be used to establish long exposure.
Targets:
744 → 749.5 → 753 → 755.5 → 760
Premium Tip
Price may temporarily break below a bounce zone, create the appearance of a failed support level, and then quickly reclaim the area.
Because of this, entries can be considered after an hourly bullish candle close back above the level.
Position Management Rules
1. Entry model: One hourly bullish candle close above the level.
2. Take profits in stages because market reversals can happen unexpectedly.
3. After the first profit target is reached, move the stop loss on all remaining contracts to breakeven and create a risk-free position.
4. Reactions from key zones must be confirmed before entering. We do not predict. We react to price.
5. Daily close below the bounce zone = stop loss.
Notice: My previous SPY and QQQ content since 2025 has been removed due to a TradingView house rules violation. This included my regular weekly outlooks and mid week market updates.
This analysis is for educational purposes only and reflects my personal opinion. It is not financial advice.  Long
Long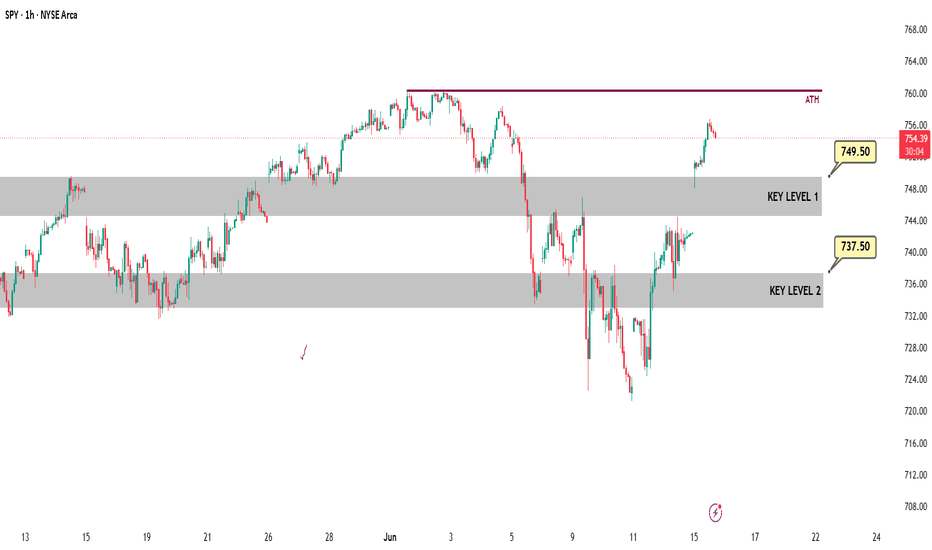
Long 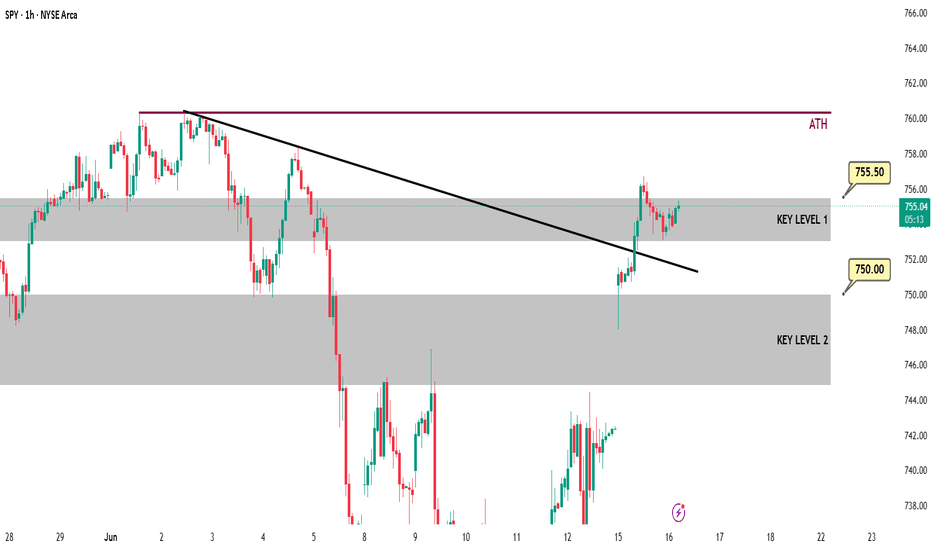
Long 
Weekly Bias — 22 JuneThe market is still in an intermediate-term bull trend, but leadership is becoming increasingly narrow & more dependent on semis
Money continues rotating into semis → AI infrastructure, chips, networking & memory
Money is leaving software
Leadership concentrated in NASDAQ:NVDA , NASDAQ:AVGO , NASDAQ:AMD & NASDAQ:MU
NASDAQ:NVDA is still bullish, reclaiming MAs, RSI recovering, MACD improving & volume expanding
NASDAQ:AVGO looks ready for another attempt toward highs
NASDAQ:AMD nearly completed a V-shaped reversal
NASDAQ:MU is nearly back at highs, volume expanding with excellent momentum
NASDAQ:GOOGL could become a catch-up trade
NASDAQ:AAPL is still weak
NASDAQ:MSFT is below several retracement levels
NASDAQ:META is still consolidating & neither bullish nor bearish, but needs to reclaim $600
NASDAQ:TSLA is range-bound with no clear edge
Everything depends on NASDAQ:NVDA , NASDAQ:AVGO , NASDAQ:AMD & NASDAQ:MU , so if semis finally roll over, the market likely follows
Brief consolidation or shallow pullback early in the week as the market digests recent gains Buyers step in quickly, especially if yields remain soft
Semis resume leadership & pull NASDAQ:QQQ to new highs
Rotation broadens into laggards ( NASDAQ:MSFT , NASDAQ:GOOGL , NASDAQ:AAPL ), allowing the index to grind higher with healthier breadth
Semi leadership finally stalls, breadth weakens further & NASDAQ:QQQ experiences a sharper 3–5% correction
The primary caution is the increasingly concentrated leadership — it's not a sell signal today, but it means monitoring the semi complex closely, as it has become the market's key source of strength
The options market isn't positioned defensively
Combined with falling long-end Treasury yields, VIX around 18, semi leadership & improving momentum, the option positioning remains supportive of higher prices, although there are several gamma magnets that could pin price early in the week
AMEX:SPY
Price reclaimed 20d EMA & 78.6% retracement while holding comfortably above the 50d EMA
The $760 level is important because it's the recent swing high
The $750 strike dominates
This looks like the primary dealer gamma pivot
Above $750, dealers likely become longer gamma, volatility compresses & upside can grind higher
Below $745, put positioning becomes much heavier
NASDAQ:QQQ
Trend is still making higher highs & higher lows (fairly balanced)
Well above the rising 50d EMA (~$693)
Above all major Fibonacci retracement levels from the recent advance
The recent pullback didn't damage the intermediate trend
There are 2 obvious liquidity pools — ATH & 20d EMA
The market hasn't taken either side
Still a continuation structure
The biggest feature is the enormous concentration around $740
Below $735, gamma begins decreasing
Above $745, positive gamma likely expands
If NASDAQ:QQQ gets above $745 early in the week there isn't much nearby resistance until new call writers appear
AMEX:IWM
$290 is a massive support level
$300 is a major upside magnet
Very little put interest exists above $300
If AMEX:IWM breaks above $300, dealers may have to chase delta higher because there's very little put inventory offsetting call exposure
A decisive move through the highs would ideally come with a more noticeable expansion in volume
Initial move toward the dominant gamma strikes ( AMEX:SPY $750, NASDAQ:QQQ $740–$745)
If those levels hold, expect intraday mean-reversion & relatively muted volatility
Above these levels, supportive macro conditions & dealer positioning continues to favor a grind higher rather than the start of a larger correction
Favors buying shallow pullbacks
Bullish (≈60%)
NASDAQ:QQQ reclaims $745 & extends toward $750
AMEX:SPY pushes through $750 toward $755.
Semis continue to lead while laggards ( NASDAQ:AAPL , NASDAQ:MSFT ) stabilize
Neutral (≈25%)
Price oscillates around the major gamma pins ( AMEX:SPY $750, NASDAQ:QQQ $740) as dealers dampen realized volatility
Bearish (≈15%)
AMEX:SPY loses $745 & NASDAQ:QQQ breaks below $735
Moves price away from the high positive-gamma area, allowing volatility to expand & increases the odds of a deeper pullback
All 3 ETFs are essentially telling the same story
Current RSI ~60 is the sweet spot — neither overbought or oversold which leaves room to go higher
Stochastic is turning back upward → first pullback resets momentum, then buyers re-enter
Momentum is improving before the MACD line crosses higher
This is an early bullish momentum signal rather than a late one
Price held above prior lows + momentum already improving = hidden bullish continuation
Across the technicals, intermarket data & option positioning, the evidence remains tilted toward trend continuation rather than distribution
The June pullback appears more consistent with a liquidity sweep that reset momentum than the start of a larger bearish reversal
The market has supportive macro conditions (easing long-end yields), contained volatility & strong semi leadership
The one area that deserves continued monitoring is breadth
If semis continue to lead while participation gradually broadens into lagging mega-cap names such as NASDAQ:MSFT , NASDAQ:GOOGL & NASDAQ:AAPL , the rally becomes more durable
If semi leadership falters before breadth improves, the risk of a sharper correction rises materially
Right now; however, the charts still favor buying controlled pullbacks over anticipating an immediate trend reversal
NASDAQ:QQQ
Buy 5–10 DTE slightly ITM calls on any pullback into $722–$726, provided that level is defended intraday
If $740–$745 is reclaimed on expanding volume, rotate into 7–14 DTE ATM calls & trail stops rather than taking profits immediately
Invalidation on a daily close below $715 would invalidate the near-term bullish thesis & increase the probability of a move toward the rising 50d EMA near $693
AMEX:SPY
Buy 5–10 DTE slightly ITM calls on pullbacks into $743–$745 that hold intraday
If AMEX:SPY closes above $750 on expanding volume, shift to 7–14 DTE ATM calls and target $760–$775
The near-term bullish thesis weakens on a daily close below $739 & is invalidated if AMEX:SPY loses $730 on strong volume, which would substantially increase the probability of a test of the rising 50d EMA in the $715–$720 region
AMEX:IWM
Buy 5–10 DTE slightly ITM calls on pullbacks into $288–$290 that hold
If AMEX:IWM closes above $300, consider rolling into 10–21 DTE ATM calls targeting $310–$318
The bullish thesis begins to weaken below $285 & is invalidated on a decisive close below $281 (the rising 50d EMA)
A loss of that level would shift the focus toward a retest of $270–$275, where the next meaningful support resides
The market is still in an intermediate-term bull trend, but leadership is becoming increasingly narrow & more dependent on semis
NASDAQ:QQQ — strongest momentum, supported by easing long-end yields & semi leadership
AMEX:IWM — improving breadth & a favorable technical structure with a clean $300 breakout trigger
AMEX:SPY — still constructive, but more likely to grind higher than accelerate due to heavier overhead gamma around $750–$760
NASDAQ:MU is one of the strongest-looking semi names
NASDAQ:NVDA , NASDAQ:AVGO , NASDAQ:AMD & NASDAQ:MU are leading the market
NASDAQ:MU is more than just a single-stock event — it has the potential to influence sentiment across the AI supply chain
Bullish (≈50%)
NASDAQ:MU delivers better-than-expected HBM & DRAM guidance
Gross margin beats expectations
Strong AI memory demand commentary
Positive Q4 outlook
NASDAQ:QQQ challenges $748–$750
NASDAQ:NVDA , NASDAQ:AVGO , NASDAQ:AMD , NASDAQ:ARM & other AI names participate
Neutral (≈30%)
Beat on earnings
Guidance merely meets expectations
NASDAQ:MU trades sideways, semis digest gains & NASDAQ:QQQ likely remains pinned around its gamma cluster
Bearish (≈20%)
Weak guidance
Softer pricing outlook
AI demand commentary disappoints
NASDAQ:MU could decline sharply
NASDAQ:QQQ likely tests $722–$730 rather than making new highs
Because semiconductor leadership has been carrying the market, a disappointing NASDAQ:MU report would probably have an outsized effect on NASDAQ:QQQ
Core PCE is the key macro event on Thursday & it directly influences yields
If core PCE is cooler than expected → 10Y yield likely moves lower, growth stocks benefit & positive NASDAQ:MU guidance would amplify the move
If core PCE is hotter → 10Y yield could rebound toward 4.5–4.6%, high-multiple AI names would likely see valuation pressure & NASDAQ:MU would need an exceptional report to offset the macro headwind
Implied volatility is likely to remain elevated into Wednesday & then contract afterward
Favor 3 or 10 July expirations over very short-dated weeklies
They provide enough time for the market to digest both NASDAQ:MU & Thursday's macro data while reducing the impact of rapid theta decay
NASDAQ:MU beats or guides positively and core PCE is benign enough for NASDAQ:QQQ to challenge or exceed $748–$750
Mixed outcomes produce a consolidation between $722 & $748
NASDAQ:MU disappoints and/or core PCE comes in hot enough to push yields higher, leading to a deeper pullback toward $722–$730
NASDAQ:MU is now entering earnings from a position of strength rather than skepticism which raises the bar for the report
Price is ~19% above the 20d EMA, showing strong momentum
The breakout toward $1,149 came on elevated volume, but the recent advance has occurred on average rather than expanding volume
Momentum is re-accelerating rather than exhausting
If NASDAQ:MU reacts well to earnings, the MACD confirmation could follow quickly
1. Buy-side liquidity at $1,149
Every algorithm sees it
If earnings are strong, that's the first target
Above, there is relatively little recent price memory until roughly $1,220–1,250
2. Sell-side liquidity
The first meaningful support is $1,050–$1,070
Below, $1,000, then the rising 20d EMA near $950
The stock is already discounting strong HBM demand, AI memory strength & improving DRAM pricing, so a small beat may not be enough, but a strong beat plus raised guidance could produce another expansion leg
Bullish (≈50%)
EPS and revenue beat
HBM demand exceeds expectations
Gross margin expands
Management raises guidance
Clear $1,149 → $1,200–1,250
Neutral (≈30%)
Beat in line with expectations
Guidance is solid, but not exceptional
Stock settles into $1,080–$1,150
NASDAQ:QQQ impact is modest
Bearish (≈20%)
Weak guidance
Softer HBM demand outlook
Margin disappointment
Test $1,050, then $1,000
Worst-case retest of the rising 20d EMA around $950
Because semis are leading the market, NASDAQ:MU 's report could have an outsized effect on NASDAQ:QQQ
Strong NASDAQ:MU + benign Core PCE increases the odds that NASDAQ:QQQ breaks through $748–$750 & extends toward the next resistance area
Weak NASDAQ:MU + hotter-than-expected core PCE raises the risk of a pullback toward the $722–$730 support area
The "whisper" going into this report is meaningfully above official Wall Street consensus — biggest risk for longs as NASDAQ:MU doesn't just need to beat — it likely needs to beat & raise
Avoid holding very short-dated (0–2 DTE) long premium through the event, as implied volatility is likely to contract sharply after earnings regardless of direction
NASDAQ:MU is technically strong, with no evidence of distribution or bearish divergence so the setup favors continuation if management delivers a clear upside surprise on guidance, but the challenge isn't whether the business is healthy — the challenge is whether the results are strong enough to justify a stock already trading near ATHs
The bias remains bullish, but the focus is now on whether earnings justify a stock already trading near record highs, rather than on a momentum breakout from an earlier base
Investors are focused less on the headline numbers & more on 4 forward-looking items
HBM (High Bandwidth Memory) demand
Gross margin
Q4 revenue guidance
2027 AI capex commentary
Investors want confirmation that hyperscaler spending remains strong into next year
After a nearly 300% rally this year, the stock is unlikely to react primarily to a modest EPS beat
Instead, the market is likely to ask is AI memory demand still accelerating, is pricing still improving, can Micron supply enough HBM to meet demand, are customers committing further into 2027?
Those answers will probably matter more than whether EPS beats consensus by a few cents
Even if NASDAQ:MU reports a headline beat, the stock could still sell-off if management suggests HBM supply is beginning to catch up with demand faster than expected, DRAM pricing is peaking, gross margin expansion is slowing, or Q4 guidance is merely in line with expectations
Thursday morning is the higher-risk event for the indexes
If NASDAQ:MU is strong, the market will already be leaning bullish into Thursday morning, which means GDP & core PCE determine whether buyers can sustain the move or whether they sell-the-news
The market has been rewarding disinflation & AI simultaneously
If NASDAQ:MU validates the AI spending narrative & core PCE doesn't challenge the recent decline in Treasury yields, those 2 catalysts reinforce each other rather than compete
In that case, expect institutions to treat any early Thursday volatility as a buying opportunity, with semis continuing to lead the advance
The main risk isn't GDP — it's a core PCE surprise that pushes the 10Y yield decisively back above the recent range & forces a repricing of growth-stock valuations
The market isn't pricing a large macro shock for Thursday as of Friday's close
The options positioning suggests traders expect movement, but not a major regime change
While the exact consensus can still shift before the release, the market narrative going into Thursday is approximately headline PCE (MoM) around 0.1–0.2%, core PCE (MoM) around 0.2% & core PCE (YoY) around 2.7–2.8%
The "whisper" is generally that inflation continues to cool gradually rather than collapse
0.2% core MoM → largely expected
0.1% or lower → dovish surprise
0.3% → manageable, but likely pushes yields modestly higher
0.4%+ → meaningful hawkish surprise that could pressure growth stocks
The positioning suggests something close to NASDAQ:QQQ ±1.3–1.8%, AMEX:SPY ±1.0–1.3% & AMEX:IWM ±1.5–2.0%
The biggest change versus last week is that the burden of proof has shifted from the technicals to the catalysts
The charts are already bullish
Now the market needs NASDAQ:MU & PCE to validate that positioning
The first 30–60 minutes after 8:30 should tell us whether the overnight move is likely to persist
If Thursday resolves positively, momentum funds often continue adding into quarter-end strength
If Thursday disappoints, Friday can become a profit-taking session
Bullish (≈45%)
NASDAQ:MU beat, raise guidance & HBM demand remains supply constrained → core PCE → 0.2% or cooler → 10Y falls toward 4.4% → semis outperforms again → QQQ breaks $748–$750 → AMEX:SPY
breaks $760 → AMEX:IWM breaks $300
Neutral (≈35%)
NASDAQ:MU strong → PCE in-line → market rallies → consolidates → NASDAQ:QQQ $740–$750, AMEX:SPY $748–$760 & AMEX:IWM $295–$300
Bearish (≈20%)
NASDAQ:MU fine → core PCE 0.3–0.4% → 10Y back above 4.5% → semis fade → QQQ returns toward $730–$735
Monday–Tuesday
Quiet, range-bound trade around the dominant gamma levels as participants wait for catalysts
Watch whether NASDAQ:QQQ holds $740–$745 & AMEX:SPY holds $745–$750
Buy support, avoid chasing breakouts
Wednesday
Volatility compresses into the close
NASDAQ:MU earnings set the tone for semi sentiment
Watch Treasury yields & semi relative strength
Keep position sizes measured ahead of earnings
Reduce event risk if you're overexposed to very short-dated options
Favor defined-risk structures
Focus on NASDAQ:MU guidance, HBM commentary & Q4 outlook — not just EPS
Let the initial reaction settle before drawing conclusions
Thursday
If NASDAQ:MU is well received & core PCE is at or below expectations, expect the strongest directional move of the week, with NASDAQ:QQQ challenging $748–$750 & potentially extending toward $760–$772, AMEX:SPY targeting $760 & AMEX:IWM attempting a sustained move above $300
If NASDAQ:MU is strong, but core PCE is hotter than expected, expect an initial rally that fades as Treasury yields rise
Watch core PCE first, then the 10Y yield, then whether QQQ/SPY hold any overnight gains Trade the confirmation rather than the headline
Friday
Follow-through day
Either momentum continues if Thursday confirms the bullish case, or the market consolidates/retraces if Thursday disappoints
Look for continuation if Thursday confirms the trend; otherwise, watch for orderly profit-taking into the weekend
Stay with the prevailing trend unless key support breaks
I'd still characterize this as a "buy the dip until proven otherwise" market since the bullish thesis remains intact as long as NASDAQ:QQQ holds roughly $722–$730, AMEX:SPY holds $743–$745 & AMEX:IWM holds $290–$288 — the event most likely to invalidate that thesis this week is a hotter-than-expected core PCE that drives a sustained rise in long-end yields; rather than, NASDAQ:MU earnings alone Strait Closed - Oil to Rip Higher?Brent crude has pulled back to a support level as of Thursday. Since the market has closed, the talks in Switzerland were cancelled and the hostilities have continued in Lebanon. POTUS has distanced himself from the continued fighting, but the Iranians have decided to shut the Strait due to the MOU clause being broken. So what's next?
I expect oil reserves to continue depleting at historical levels. The supply shock will likely send it above $100 this coming few days. If a deal is not struck in the coming weeks, the situation will get dire.
Who are the beneficiaries? The oil businesses, particularly the nation states that dominate the space. Looking at the Saudi (KSA) etf, it has surprisingly trailed the oil chart. We have a clear bull flag pattern, currently consolidating under resistance, ready to pop out and follow the price of Brent.
I fully expect continued breaches of the peace deal (or MOU), and oil to bounce. If this is the case, a KSA long could be in play. The EMA's are coiling up tightly, the ETF is lagging oil (which it usually tracks), I fully expect that if the geopolitical situation remains as it is, this could have a break out move.
Not financial advice  Long
Long
VTI: The U.S. Market Is Preparing for New HighsThe Vanguard Total Stock Market ETF (VTI) is one of the largest exchange-traded funds in the United States and tracks the performance of nearly the entire U.S. equity market. The fund holds thousands of companies across multiple sectors, making it one of the most widely followed indicators of overall market strength. As a result, both institutional and retail investors closely monitor its performance.
From a fundamental perspective, the U.S. stock market continues to benefit from resilient corporate earnings, ongoing investments in technology and artificial intelligence, and strong investor demand for growth-oriented assets. Additional support comes from the overall stability of the U.S. economy and expectations for continued business expansion among major corporations. Key risks include a potential economic slowdown, changes in Federal Reserve policy, and elevated valuations across certain market segments.
From a technical perspective, this analysis is based on the daily timeframe. Following a strong recovery from the spring lows, VTI has successfully reclaimed major moving averages and continues to build a bullish structure within a long-term ascending channel. The 345–355 area remains a critical support zone where buyers previously stepped in aggressively. Momentum indicators continue to support the bullish outlook, while trading volume remains healthy following the recent recovery. The next major target is located near 392, where significant resistance is expected. A successful breakout above that level could open the door toward the previous all-time high around 405–406. As long as price remains above support, buyers continue to maintain control. This publication reflects personal opinion only and should not be considered investment advice.  Long
Long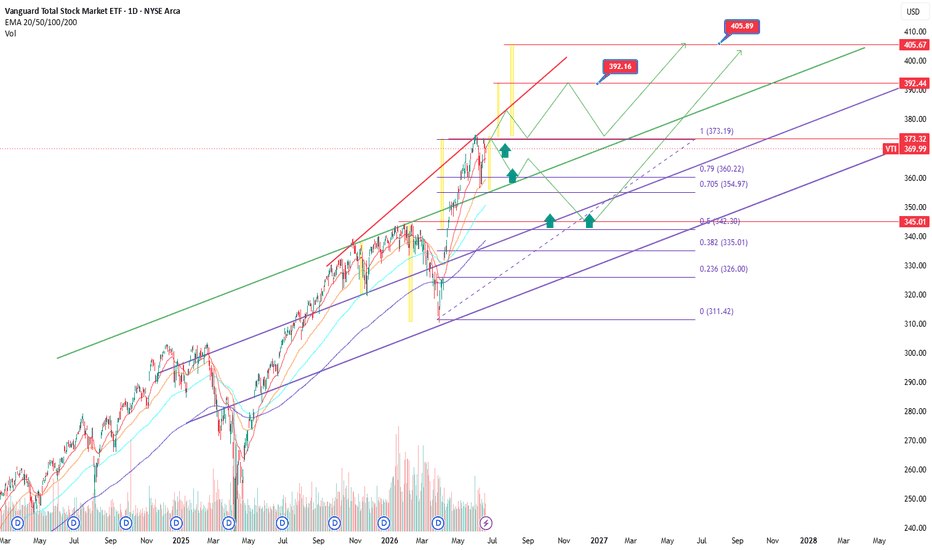
 Long
Long
Long
Glassnode Engages with BTC CVDD/Price Ratio as Market Metrics Glassnode Engages with BTC CVDD/Price Ratio as Market Metrics Glassnode recently highlighted Bitcoin’s CVDD/Price Ratio, which currently stands at 0.73 and is climbing. This engagement, noted in a tweet, reflects increased market interest in this critical price metric. The tweet garnered significant interaction, receiving 92 likes, 24 retweets, and 9 replies, indicating a robust discussion among traders and analysts.
The Story So Far
The broader crypto market is displaying mixed signals, with Bitcoin’s CVDD/Price Ratio becoming a focal point for traders. As of June 8, 2026, this ratio has trended upwards, suggesting potential shifts in market dynamics. Historically, during prior cycle lows, the CVDD/Price Ratio peaked around 1, which occurred in 2015, 2018, and 2022. The fact that it is now at 0.73 indicates that traders may be evaluating potential price recovery scenarios. The tweet’s engagement points to a growing interest in how this metric correlates with Bitcoin’s price movements and overall market sentiment.
Glassnode is a well-respected analytics firm in the cryptocurrency space, providing insights into on-chain data for Bitcoin and other cryptocurrencies. The CVDD/Price Ratio is a significant metric that helps traders understand market cycles and price corrections. Historically, this metric has been instrumental in identifying potential price bottoms during previous market cycles.
Key Levels to Watch
Traders are now closely watching the CVDD/Price Ratio as it climbs. The current level of 0.73 may signal potential buying opportunities, particularly if it approaches historical peak levels around 1. Additionally, engagement trends suggest that traders are more interested in metrics that indicate market sentiment, which could lead to increased volatility in the coming weeks. Observers should remain cautious, as any significant shifts in Bitcoin’s price could impact overall market dynamics, especially if the ratio continues to climb. Analysts will likely use this metric alongside other indicators to gauge future price movements.
 Short
Short
AIQ ETF: Artificial Intelligence - Is The New One Bitcoin!?Everyone was talking about ChatGPT in the last quarter.
Investors were trading on a rush. Thanks to launch of the bot, well-known stocks, such as NVIDIA shares, have shown the highest profitability among all stocks - components of the S&P500 and Nasdaq-100 indices since the beginning of the year.
Previously low-profile AI stocks like MobilEyE Global , Ambarella , C3.ai have become more popular.
OpenAI introduced ChatGPT on November 30th, and since then it has demonstrated the ability to perform a number of tasks such as writing stock articles, firing emails, and even messaging on dating apps.
ChatGPT is a conversational AI chatbot developed by OpenAI that supports natural language queries.
The buzz exploded and blew the roof off when it was reported OpenAI is to receive a $10 billion investment from Microsoft .
Undoubtedly, the launch of ChatGPT has become one of the most disruptive topics in the financial markets in Q1 2023.
And now, at the beginning of a new quarter, here is a publication that was fully created by ChatGPT Artificial Intelligence, under request to tell a 1200-word Fantastic story Artificial intelligence Becomes The Next Bitcoin.
Good or bad, y'all be the judge. But here's what ChatGPT said...
n the year 2040, the world had seen incredible advancements in technology. The most talked-about topic was artificial intelligence (AI). AI had become a ubiquitous part of daily life; from self-driving cars to chatbots, AI was everywhere.
But there was something different about this AI. It was not just a tool to make our lives easier; it was a valuable asset that people could invest in. The AI market had become the next big thing, and some even compared it to the early days of Bitcoin.
A young man named Jack had always been fascinated by AI. He had studied computer science in college and had been working at a tech company for a few years. Jack was always looking for the next big thing, and when he heard about the AI market, he knew he had to get involved.
At first, Jack was hesitant to invest his money in something that seemed so new and untested. But as he researched more and more, he became convinced that AI was the future. He decided to take the plunge and invested all of his savings into an AI startup called Mindworks.
The startup had a revolutionary new product that used AI to predict market trends. It was unlike anything else on the market, and investors were taking notice. The company's stock began to rise, and soon Jack's investment was worth ten times what he had put in.
Jack was thrilled with his investment, but he knew that the market was volatile. He had seen what had happened with Bitcoin; it had soared to incredible heights before crashing down. He didn't want to make the same mistake.
As he watched the market closely, he noticed that there were other startups popping up all over the place. Some were using AI to create better healthcare solutions, while others were developing AI-powered robots that could do jobs humans couldn't.
Jack realized that the AI market was growing fast, and he needed to stay on top of things if he wanted to continue to make money. He decided to start a blog where he could share his insights into the AI market and offer advice to other investors.
The blog quickly became popular, and Jack was soon seen as an expert in the field. He was invited to speak at conferences and was even featured on news programs. He was living the dream, making money from something he loved and helping others do the same.
But as the AI market continued to grow, so did the competition. The startups that had once been small and unknown were now getting funding from big-name investors. The market was becoming saturated, and it was becoming harder and harder to stand out.
Jack knew that he needed to do something to differentiate himself from the competition. He decided to create an AI-powered platform that could analyze the market data in real-time and make investment recommendations.
It took months of hard work, but Jack finally launched his platform. It was an instant success, and investors were lining up to use it. Jack's platform was unlike anything else on the market, and it quickly became the go-to tool for AI investors.
As the market continued to grow, so did Jack's wealth. He had become a millionaire, thanks to his investments in the AI market. But he never forgot his roots and continued to offer advice to other investors through his blog.
The AI market had become the next big thing, and Jack had been there from the beginning. He had seen the potential of AI and had taken a chance on something new and untested. And now, he was reaping the rewards.
As he looked back on his journey, he realized that he had become a part of something much bigger than himself. The AI market was changing the world, and he had played a small part in making that happen.
Jack knew that there would be ups and downs in the market, but he was confident that AI was here to stay. It was the future, and he was excited to see where it would take us.
The end.
The main chart illustrates that the Bearish Trend in AIQ ETF - Global X Artificial Intelligence & Technology ETF is also - the end 😊
Short 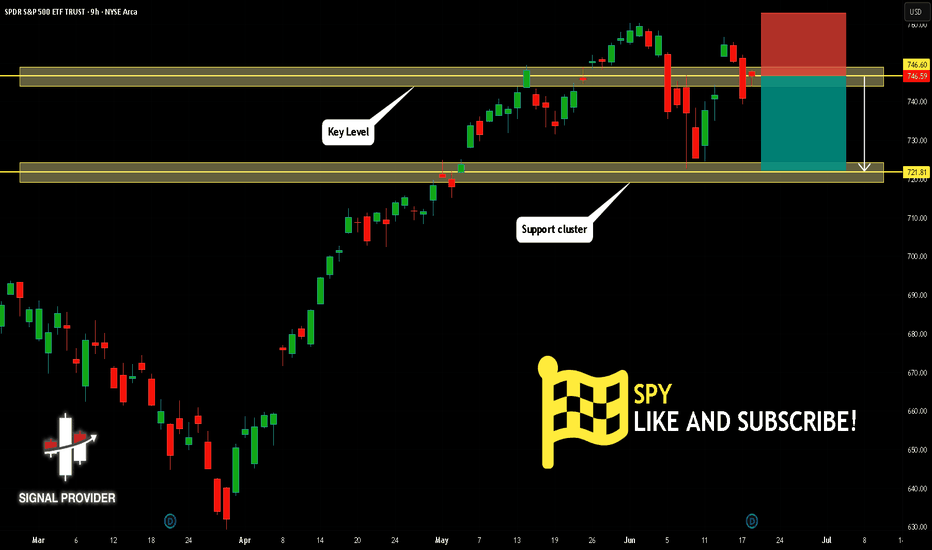
Short 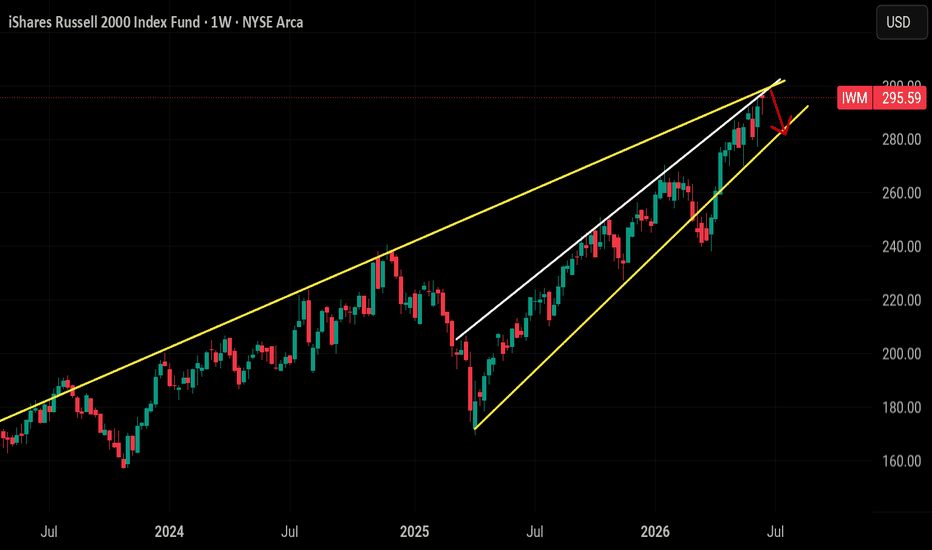
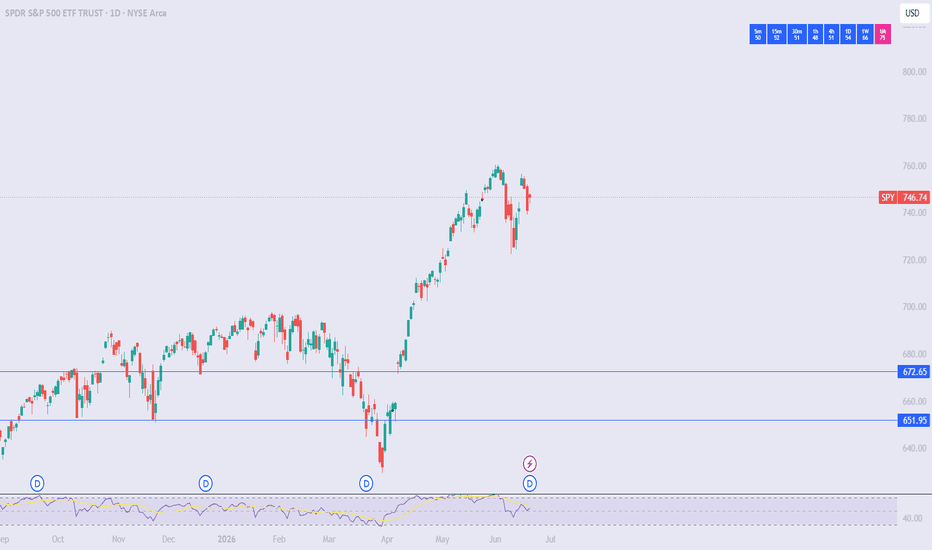
SPY - Bear Print From Wednesday Is Still Holding Full ConvictionSPY's Bear Print From Wednesday Is Still Holding Full Conviction
Three Days Later.
The 20-bar-old bear announcement at CQJ 68.4 has barely moved
since it fired. On Wednesday it read 68.62, today it reads
68.4. For context, NVDA's fresh bear print from the same
period decayed from 74.93 to 55.68 (replaced entirely by a
bull flip) over the same window. SPY's version just sat there.
Price bounced from the 738.42 low back to 747.01, the Hourly
compressed to mid-range across the board (RCZ 37th, ATR 47th,
Vol Elev 40th), and the announcement didn't flinch. The Daily
is telling a different story again, GREEN light, Q3 neutral,
IMP at 3/5 in MIXED mode, Vol Elev at 90th with Open Hour
active, and a 214-bar-old bull announcement that has never
been replaced. The two timeframes have been disagreeing all
week and neither has blinked.
Resistance: 748.17-750.30 -- yesterday's high and the gap zone
Key resistance: 752.15-754.69 -- this week's breakdown origin
Current price: 747.01
Support: 740.44-741.02 -- nearest shelf below
Key support: 736.50-738.42 -- this week's tested floor
Thesis line: 721.23 -- the broader structural floor
Two paths from here:
The Hourly catches up to the Daily (bullish resolution):
A fresh bull announcement fires on the 1H to override the
standing bear print, Vol Elev climbs off 40th, IMP scores
1+ in PART mode, price clears 750.30. Opens 752.15.
The Daily catches down to the Hourly (bearish resolution):
The Daily's GREEN light and 214-bar bull announcement finally
give way to the selling pressure the Hourly has been reading
all week. Price loses 740.44, IMP loads on the Daily past 3/5.
Opens 736.50.
This is the third consecutive session where SPY's cross-
timeframe disagreement has been the defining feature. Something
has to give, but the system isn't telling you which side yet.
---
Built with SYNTHESIS v3.3 | SOM / ACE / IMP / SYNTHESIS
Study, not financial advice.