1-2 i-ii mini-me speaks for itself. Easy call on a 1-2 1-2 pattern here with nearly identical fractals to start a long and prosperous third wave of a bull cycle. Pot's bottomed, fundamentals/legislation line up, the only thing suppressing prices are lack of institutional money (soon to come as that is what will fuel the bull cycle) and the residual skepticism of ppl selling the rip. I was one of those... not any more.
Technical signs to look as we ascend. Long inverted wicks that result in higher closes in subsequent days will show news sellers getting punished. There's a saying in trading... you keep doing it until it stops working. When selling the rip starts making you regret your choices, weak hands turn into strong hands.
3X at this time next year would not surprise me.
*not financial advice*
ETF market
USO (Oil Proxy): Week of Aug 31See levels and key areas for this week:
After you click the link, click “Grab this Chart” at the bottom/right of the chart or Load Live Bars on far middle-right.
“Grab this Chart” opens a copy of the chart environment, but it doesn’t automatically save as a permanent layout in your dashboard. Once the chart opens, you need to manually save it as your own layout by clicking the cloud/save icon at the top of TradingView , “Save As”, name the layout. After that it will show up in your saved layouts/dashboard going forward.
SMH: Week of Aug 31See levels and key areas for this week:
After you click the link, click “Grab this Chart” at the bottom/right of the chart or Load Live Bars on far middle-right.
“Grab this Chart” opens a copy of the chart environment, but it doesn’t automatically save as a permanent layout in your dashboard. Once the chart opens, you need to manually save it as your own layout by clicking the cloud/save icon at the top of TradingView , “Save As”, name the layout. After that it will show up in your saved layouts/dashboard going forward.
Sector Rotation: Full August View - Week of Aug 31See levels and key areas for this week:
After you click the link, click “Grab this Chart” at the bottom/right of the chart or Load Live Bars on far middle-right.
“Grab this Chart” opens a copy of the chart environment, but it doesn’t automatically save as a permanent layout in your dashboard. Once the chart opens, you need to manually save it as your own layout by clicking the cloud/save icon at the top of TradingView , “Save As”, name the layout. After that it will show up in your saved layouts/dashboard going forward.
RSP/SPY (Market Participation View): Week of Aug 31See levels and key areas for this week:
After you click the link, click “Grab this Chart” at the bottom/right of the chart or Load Live Bars on far middle-right.
“Grab this Chart” opens a copy of the chart environment, but it doesn’t automatically save as a permanent layout in your dashboard. Once the chart opens, you need to manually save it as your own layout by clicking the cloud/save icon at the top of TradingView , “Save As”, name the layout. After that it will show up in your saved layouts/dashboard going forward.
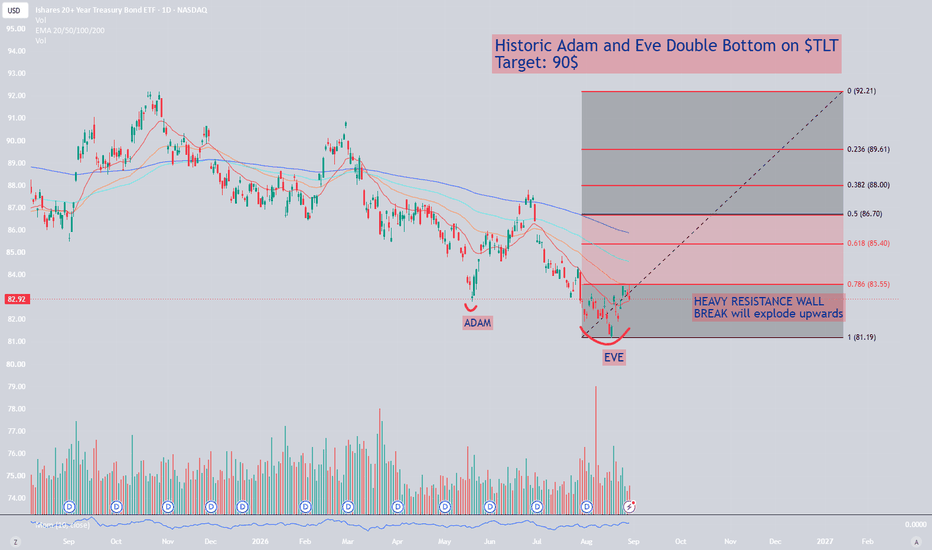
Potential key reversal bottom detected for ZROZAwait signals for entry such as DMI/ADX and/or RSI (preferably both) swing to the bullish direction following the pullback after the initial major move on 19th August.
Stop loss for the trade involving AMEX:ZROZ (and indication that this trade is an absolute 'no-go') is any trade below the low of the signal day of 18th August (i.e.: any trade below $56.80).
P.S.: This is a 'proxy' trade for the TLT in which a lot more volume traded through ZROZ compared to TLT on a relative basis.
Opening: GLD October 16th 2x 369/374/440/450 Iron Condor... for a 2.74 credit.
Comments: Adding out in the October monthly. Primarily in this for its lack of correlation to the broad market. Going double double on the put side to accommodate skew ... .
Metrics:
Max Profit: 2.74 ($274)
Max Loss: 7.16 ($716)
ROC at Max: 38.3%
ROC at 50% Max: 19.1%
ROC at 10% of the width of the widest wing: 14.0%
Money, taking, running at 10% of the width of the widest wing rather than farting around waiting for 50% max to come in.
SPY / SPX Weekly Outlook – Week 34 of 2026 (24-28 AUG)SPY / SPX WEEKLY MARKET OUTLOOK
SPY Weekly Recap Outlook
We didn't take any trades on SPY this week because none of the key levels or scenarios we had mapped out were triggered.
(For reference, I have included last week's outlook on the right.)
UA CAPITAL Trading Desk Weekly Execution Metrics
Total Trades Taken: 13
Winning Trades: 10
Losing Trades: 3
Win Rate: 77%
Index Options: 0 Trades
Futures Desk: 3 Trades (3 Wins — ES)
Equities / Stocks: 10 Trades (7 Wins / 3 Losses)
Result: Another green week.
This Week's Scenarios / Prediction
Risk Index
This oscillator reads macro conditions and converts them into a technical risk framework. It was developed internally at UA CAPITAL and remains the primary indicator I use for both short-term and long-term positioning decisions.
Long term: Risk on
Mid term: Risk on
Short term: Risk on
A warning: Macro liquidity conditions remain fragile, and a negative news catalyst could still trigger a sharp downside flush. Geopolitical risk, particularly the Iran conflict, remains elevated, while the macro environment continues to show significant compression and imbalance.
Scenarios / Strategies
Long Scenario 1
Flip Zone (758.5) This is the first major demand zone. If price reclaims this level with a confirmed 1-hour bullish candle close, long exposure can be considered.
Trigger: Price must test the level and produce a bullish 1-hour candle close back above the zone.
Targets: Take partial profits after every $1 advance.
Invalidation: 1-hour candle close below 749.
Long Scenario 2
Demand (749.75) This is the second demand zone. If price reclaims this level with a confirmed 1-hour bullish candle close, long exposure can be considered.
Trigger: Price must test the level and produce a bullish 1-hour candle close back above the zone.
Targets: Take partial profits after every $1 advance.
Invalidation: 4-hour candle close below 745.
Long Scenario 3
Flip Level (767.75) This is the Flip Level for SPY to watch. If price breaks above this level with a strong 4-hour candle close and subsequently retests the level, a long setup can be considered.
Trigger: Price must retest the level from above and produce a bullish 1-hour or 15-minute candle close back above the zone for a more aggressive entry.
Targets: Take partial profits after every $1 advance.
Invalidation: 4-hour candle close below 765.
Position Management Rules
1. Entry model: Unique for every scenario. Read each setup carefully before entering.
2. Take profits in stages because market reversals can happen quickly.
3. After the first profit target is reached, move all remaining stop losses to breakeven and convert the position into a risk-free trade.
4. A reaction from the level must be confirmed. We do not predict price. We react to price.
5. Invalidation levels are unique for each scenario. Read them carefully.
6. SPY & QQQ charts use RTH (Regular Trading Hours). ES & NQ charts use ETH (Electronic Trading Hours).
This analysis is for educational purposes only and reflects my personal opinion. It is not financial advice.
QQQ / NDX Weekly Outlook – Week 34 of 2026 (24-28 AUG)QQQ WEEKLY MARKET OUTLOOK
QQQ Weekly Recap Outlook
We didn't take any trades on QQQ this week because none of the key levels or scenarios we had mapped out were triggered.
(For reference, I have included last week's outlook on the right.)
UA CAPITAL Trading Desk Weekly Execution Metrics
Total Trades Taken: 13
Winning Trades: 10
Losing Trades: 3
Win Rate: 77%
Index Options: 0 Trades
Futures Desk: 3 Trades (3 Wins — ES)
Equities / Stocks: 10 Trades (7 Wins / 3 Losses)
Result: Another green week.
This Week's Scenarios / Prediction
Risk Index
This oscillator reads macro conditions and converts them into a technical risk framework. It was developed internally at UA CAPITAL and remains the primary indicator I use for both short-term and long-term positioning decisions.
Long term: Risk on
Mid term: Risk on
Short term: Risk on
A warning: Macro liquidity conditions remain fragile, and a negative news catalyst could still trigger a sharp downside flush. Geopolitical risk, particularly the Iran conflict, remains elevated, while the macro environment continues to show significant compression and imbalance.
Scenarios / Strategies
Long Scenario 1
Demand 1 (704) This is the first major demand zone. If price reclaims this level with a confirmed 1-hour bullish candle close, long exposure can be considered.
Trigger: Price must test the level and produce a bullish 1-hour candle close back above the zone.
Targets: Take partial profits after every $1 advance.
Invalidation: 1-hour candle close below 698.
Long Scenario 2
Demand 2 (690.75) This is the second major demand zone. If price reclaims this level with a confirmed 1-hour bullish candle close, long exposure can be considered.
Trigger: Price must test the level and produce a bullish 1-hour candle close back above the zone.
Targets: Take partial profits after every $1 advance.
Invalidation: 4-hour candle close below 685.
Long Scenario 3
Flip Level (713.5) This is the Flip Level for QQQ to watch. If price breaks above this level with a strong 4-hour candle close and subsequently retests the level, a long setup can be considered.
Trigger: Price must retest the level from above and produce a bullish 1-hour or 15-minute candle close back above the zone for a more aggressive entry.
Targets: Take partial profits after every $1 advance.
Invalidation: 4-hour candle close below 713.
Position Management Rules
1. Entry model: Unique for every scenario. Read each setup carefully before entering.
2. Take profits in stages because market reversals can happen quickly.
3. After the first profit target is reached, move all remaining stop losses to breakeven and convert the position into a risk-free trade.
4. A reaction from the level must be confirmed. We do not predict price. We react to price.
5. Invalidation levels are unique for each scenario. Read them carefully.
6. SPY & QQQ charts use RTH (Regular Trading Hours). ES & NQ charts use ETH (Electronic Trading Hours).
This analysis is for educational purposes only and reflects my personal opinion. It is not financial advice.
Opening: XBI October 16th 142/152/180/190 Iron Condor... for a 2.86 credit.
Comments: IV isn't as high as I would like, but this isn't the greatest premium-selling market at the moment with VIX sub-15 ... . Generally looking to keep some theta on and burning, while keeping some powder dry on the side for any higherIV slopportunities that come along.
Metrics:
Max Profit: 2.86 ($286)
Max Loss: 7.14 ($714)
ROC at Max: 40.0%
ROC at 50% Max: 20.0%
ROC at 10% of the width of the widest wing: 14.0%
Will generally look to money, take, run at 10% of the width of the wing (1.00/$100).
Opening: SMH October 16th 510/520/620/630 Iron Condor... for a 4.20 credit.
Comments: High ETF IV at >35. Probably could've gone a smidge wider to give me more room to be wrong and still collect 1/3rd the width of the wings in credit ... .
Metrics:
Max Profit: 4.20 ($420)
Max Loss/Buying Power Effect: 5.80 ($580)
ROC at Max: 72.1%
ROC at 50% Max: 36.2%
ROC at 10% of the Width of the Widest Wing: 17.2%
Will generally look to money, take, run at 10% of the width of the wing (i.e., 1.00/$100).
Opening: QQQ October 9th 683/693/2 x 770/775 Double Double IC... for a 2.86 credit.
Comments: Selling the 25 delta short option on the put side, 2 x the -13 on the call to accommodate skew in the expiry nearest 45 DTE.
Metrics:
Max Profit: 2.86 ($286)
Max Loss/Buying Power Effect: 7.14 ($714)
ROC at Max: 40.1%
ROC at 50% Max: 20.0%
ROC at 10% of the Width of the Wing: 14.0%
Looking to money, take, run on these at 10% of the width of the widest wing (1.00/$100).
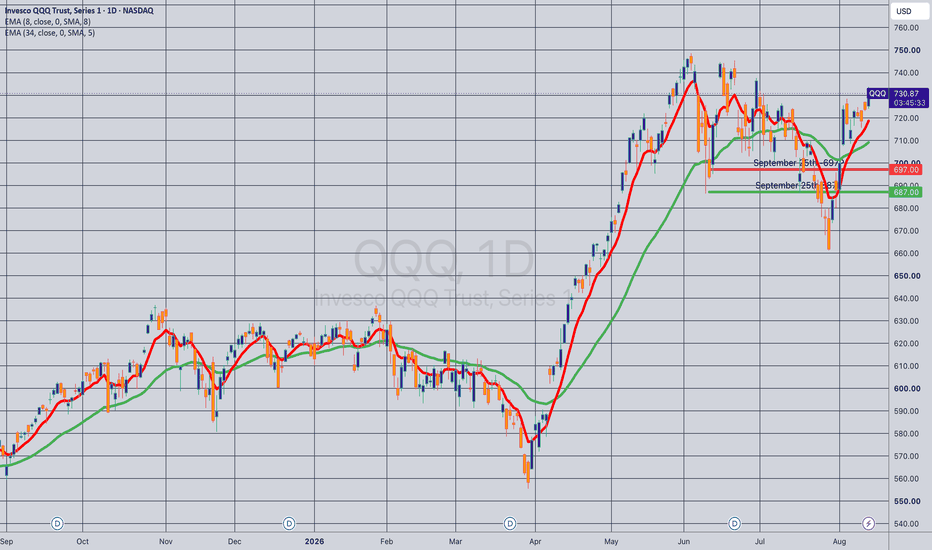
Opening: QQQ September 25th 687/697 Short Put Vertical... for a 1.75 credit.
Comments: Delta hedge, selling the 25 delta put and erecting the long out from there to pick up around 5 long delta.
This is probably not a good standalone trade, since you generally want to opt for directionally bullish on weakness plus higher IV. Will look to add in an oppositional side when and if my net delta starts to skew positive.
Position Net Delta/Theta: -5.23/11.55.
Wave 4 of 5 of 5 we have 5 of 5 still 8/29 9/3 TOP The chart posted is the spy as I see the wave structure that has formed . I have two cycles now into 8/29 to 9/3 and the next spirals grouping . I would wait for the puts until we print 783/791 focus 788 into the next cycle turn best of trades WAVETIMER
Spiral event nearing 9/09 to 9/11 from Feb 19 th2025 top F14The chart posted is my work based on golden ratio Spirals from the Spiral Calendar . On sept 10 th . We have a cluster of spiral from 9/3 to 9/10 Each turn is from a past major high and low to calculate spirals Also on sept 10th we will have a NEW MOON . I am looking for an Event on 9/10 week. So I have now moved back to 100 % cash . It is my view that since we are at the 25th anniversary of 9/11 that the time window from 9/10 to11/3/2026 The world and world markets will be in a Negative time period . This could be the window of a major Decline .based also on the 4 yr cycle low due the week of 10/16 .Best of trades WAVETIMER
NLR 1D: Three Months Inside a Zone, and the Way OutThe layer opened a zone in June. Price has just left it. NLR, the uranium and nuclear ETF, spent the summer inside a single Accumulate zone on the daily chart, and the panel now reads NO ACCUMULATION for the first time since it opened. That change of state - not the stamps themselves - is what this post is about.
A stamp is not a call. It is the start of a zone. In early June, with price around the mid-120s and sitting on the reference the layer had been carrying up since winter, Accumulate marked the chart. From that bar on, the question was never "did the stamp work" - it was "how long, and how deep, is the accumulation going to run". The answer turned out to be roughly three months and about a fifth of the price.
Inside the zone the reference kept doing its job. Price traded under the June level for seven weeks and worked down to the low 100s. The reference reset to the mid-100s with it, and the layer marked again at the low near 103, 22 bars ago - the same zone deepening, not a second opinion. That is what accumulation looks like on a daily clock: a long, unglamorous stretch below a line that keeps adapting downward while the market decides.
The exit is what changed this week. Price has climbed back through the whole summer decline and sits at 125.02, about ten percent above a reference that has since adapted up to 113.63. The panel switching to NO ACCUMULATION is the layer saying the zone has been left, not that it has stopped watching. Zones are meant to be exited in one of two directions. This one was exited upward.
Relative volume reads HIGH on this leg. That is the part that separates this exit from the low-participation returns we have written about elsewhere. Price leaving a zone on expanding participation is a stronger fact than price leaving it on quiet tape. It is a fact about the move that already happened - not a statement about the next one.
A caveat that belongs here. Zones can be exited downward too, and those charts do not get posted as often. Every chart you see was chosen by somebody. We say that out loud so the example stays an example and does not become a promise.
What we are watching, stated without a direction. Price is back at the level where the zone first opened. Acceptance means any pullback toward 113.63 is bought and the area holds as support the chart built for itself. Rejection means the mid-120s cap the move and price works back toward the line - back toward the zone it just left. Both are information. Neither is a forecast.
The layer has gone quiet. Twenty-two bars of silence while price moves is not a malfunction. A slow tool that marks a zone, tracks it for three months, and then says nothing on the way out is doing exactly what it was built to do.
Educational market commentary - not financial advice.
SPY Is Back At 771.58 With The Daily Turning Bull.SPY Is Back At 771.58 With The Daily Turning Bull.
SPY returned to the 771.58 ceiling and is trading 771.10, testing it again - but this time the daily timeframe has turned constructive, showing a long thesis with top-quartile conviction and an entry forming. The two-week range ceiling is being pressed with the higher timeframe finally on side, unlike the earlier rejections. The hourly surface is still short-term cool, so it is not confirmed, but this is the strongest test of 771.58 yet. A confirmed close above it is the event. Neutral until it clears.
Resistance: 771.58 - the ceiling being tested
Key resistance: 773.82 - shelf above
Current price: 771.10
Support: 768.15 - first support
Key support: 765.71 - the reclaimed pivot
Structural floor: 762.57 - the range floor
Two paths from here:
It closes above 771.58 and the range breaks up. With the daily now bullish, a confirmed close above 771.58 resolves the two-week range up and opens 773.82. Daily conviction behind a breakout is the strongest configuration - this is the one to watch.
It rejects 771.58 again. The ceiling has capped every attempt for two weeks. A rejection and a loss of 765.71 puts price back in the range. Until the close clears, the wall stands.
SPY is testing 771.58 for the fourth time, but now with the daily turned bullish behind it. A confirmed close above 771.58 finally breaks the range up; a rejection keeps it boxed. The higher-timeframe support makes this the best-supported test yet - watching the close.
Built with SYNTHESIS v3.3 | SOM / ACE / IMP / SYNTHESIS
Study, not financial advice.
Research 28.08.2026🌏 Markets:
AMEX:SPY -0.04 -0.01%(pre/m)
NASDAQ:QQQ -1.65 -0.23%(pre/m)
🆕 Economic News:
09:45 USA – Chicago PMI
10:00 USA – Fed Chair Warsh Speech
10:00 USA – Michigan Consumer Sentiment Final
10:00 USA – Non Farm Payrolls Annual Revision Prel
20:00 USA – Jackson Hole Symposium
📈 Gap Ups
Reaction to earnings/guidance:
NYSE:ESTC NYSE:GAP NASDAQ:AFRM NYSE:BBAR NYSE:HAFN NYSE:FRO $
Other news:
Shares of NASDAQ:SOLS soared early Friday after the company called off a dramatic acquisition that would have turned the company into even more of an AI play.
NASDAQ:TTWO shares rise after Rockstar Games releases extended GTA VI preview
Mounjaro, Eli Lilly’s NYSE:LLY diabetes drug, received FDA approval for the treatment of heart disease. NYSE:NVO shares are falling.
📉 Gap Downs
Reaction to earnings/guidance:
NASDAQ:MRVL NASDAQ:IREN NYSE:RBRK $S NASDAQ:ADSK NASDAQ:WDAY NYSE:MNSO NASDAQ:ULTA
Other news:
Bloomberg reported that a consortium comprising Advent International and Stripe had abandoned plans to acquire NASDAQ:PYPL
‼️ Additional
BTC posted the largest weekly gain in dollar terms in its history and its strongest percentage gain since March 2023 — Galaxy Research.
Fed Chair Warsh is scheduled to speak today at the Jackson Hole Economic Symposium.
Musk expects SpaceX revenue to reach $3.5 trillion by 2033.
📋 List of tickers involved:
NYSE:ESTC NYSE:GAP NASDAQ:AFRM NYSE:BBAR NYSE:HAFN NYSE:FRO NASDAQ:SOLS NASDAQ:TTWO NYSE:LLY NYSE:NVO NASDAQ:MRVL NASDAQ:IREN NYSE:RBRK $S NASDAQ:ADSK NASDAQ:WDAY NYSE:MNSO NASDAQ:ULTA NASDAQ:PYPL
Best regards – hi2morrow team.