Long
Long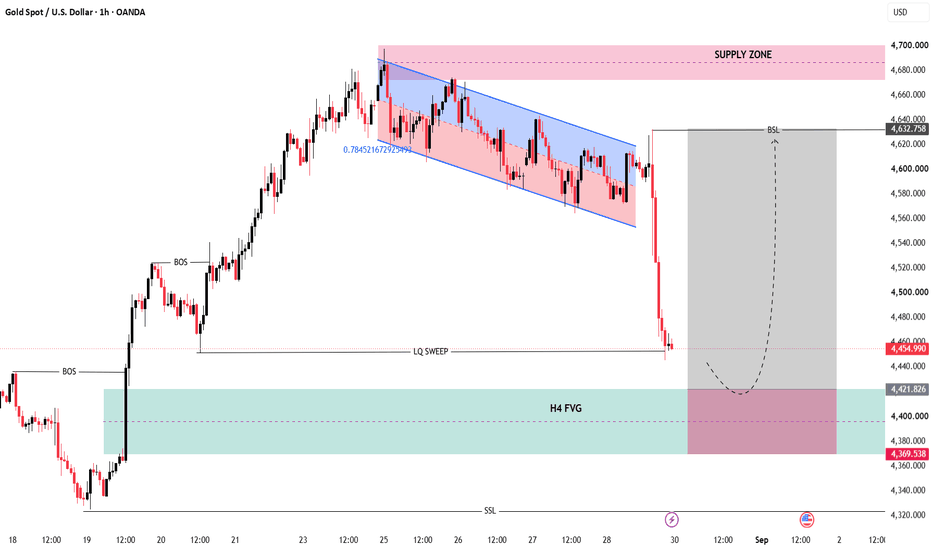
 Short
Short
Short 
 Long
Long
XAUUSD — 4,535 Retest or 4,359 Sweep?Gold has shifted into a much weaker structure after the strong breakdown from the previous bearish channel.
Price is now trading around 4,450 - 4,460 after a sharp selloff.
The market is not in a clean bullish recovery yet.
For me, the main question today is simple:
Will gold create a short-term bounce first, or continue sweeping lower toward the deeper buy zone?
The simple read
The first reaction zone is around 4,432.
This is the OB Buy Scalping Zone on the chart.
If buyers defend this area, gold may create a short-term recovery.
But the key resistance above is 4,535.
That zone is the Sell Zone / Retest Breakdown Trend area.
If price bounces into 4,535 and rejects, sellers may take control again.
Below the current structure, the deeper important buy zone is around 4,359.
This area is marked as the OB Buy Zone / retest trend area and can become a stronger reaction zone if the market continues lower.
Key price zones
Current price area: 4,450 - 4,460
First OB Buy reaction zone: 4,432
Main sell retest zone: 4,535
Deep OB Buy / trend retest zone: 4,359
Short-term recovery improves above: 4,535
Bearish pressure remains active below: 4,535
Trading plan
Short-term buy reaction scenario
If gold holds around 4,432:
A recovery toward 4,535 may appear.
But I would not treat this as a full bullish reversal too early.
The reaction at 4,535 will be more important than the bounce itself.
Sell retest scenario
If gold reaches 4,535 and rejects:
This can become the cleanest resistance reaction.
Price may rotate lower again toward 4,432.
If 4,432 fails, the next downside area is 4,359.
Deeper buy reaction scenario
If gold drops into 4,359:
I will watch for buyer reaction.
This is a deeper OB Buy / trend retest zone, but it is not an automatic buy area.
Confirmation is still required. Short 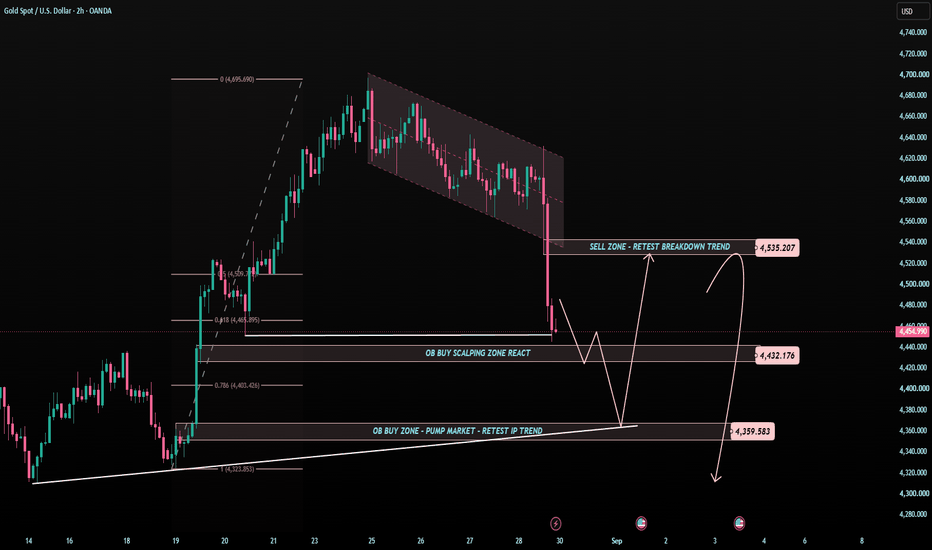
Gold: 4H & 6H SELL Alignment After Rejection From $4,697Gold has reached an important decision point after failing to sustain the rally above the $4,650–$4,697 area.
After reaching approximately $4,696.87, XAUUSD began losing momentum near the upper resistance structure. This was followed by a sharp bearish displacement with a significant expansion in volume.
The important development is that I now have bearish alignment across both timeframes:
4H: QUALITY SELL
Entry: $4,469.29
Invalidation: $4,703.75
T1: $4,317.57
T2: $4,020.72
6H: FAST SELL
Entry: $4,524.41
Invalidation: $4,703.96
T1: $4,395.55
T2: $4,317.57
Gold closed the week around $4,456.77.
The immediate area around $4,440–$4,460 is important because price is testing rising structural support. A short-term reaction or bounce from this area would therefore not be surprising.
However, unless Gold can recover and hold back above approximately $4,525–$4,550, I currently favour further downside.
My first bearish objective is the $4,395 area.
A confirmed breakdown below that region would expose the much more important $4,317 structural support, which is particularly interesting because it appears as a target on BOTH the 4H and 6H setups.
Below $4,317, the correction could become considerably deeper, with the 4H structure pointing toward approximately $4,020.
The bearish thesis is invalidated if Gold recovers above approximately $4,704.
One thing I find particularly important here is the multi-timeframe agreement. The previous bullish move has already matured, and both the 4H and 6H structures have now generated SELL conditions following rejection from the highs.
My current view:
Bias: BEARISH
Main timeframe: 4H
6H confirmation: BEARISH
Immediate resistance: $4,525–$4,550
Major resistance / invalidation: $4,704
First target: $4,395
Main target: $4,317
Extended target: $4,020
This analysis is based on market structure and price action and is not financial advice.
#Gold #XAUUSD #GoldTrading #TechnicalAnalysis #MarketStructure Short 
Gold (XAUUSD) Technical Analysis Strategy | Pullbacks are OpportGold (XAUUSD) Technical Analysis Strategy | Pullbacks are Opportunities, Trend Remains Bullish
Gold experienced a significant and rapid decline on Friday, primarily influenced by Federal Reserve Chairman Warsh's hawkish remarks at the Jackson Hole symposium. Market expectations for a September rate hike increased significantly, causing a rapid drop in gold prices.
However, I personally do not believe this decline signifies a reversal in the medium-term trend of gold. On the contrary, after the previous sharp rise, the current situation appears to be a technical correction following profit-taking at higher levels. From a longer-term perspective, continued central bank gold purchases, global fiscal and geopolitical uncertainties, and market expectations for a future shift in US monetary policy remain important medium- to long-term support for gold. Goldman Sachs recently raised its year-end 2026 gold target to $4900/oz, emphasizing that central bank gold purchases remain a key driver.
📊 Technical Analysis
The 1-hour chart clearly shows that gold previously started its upward trend from around 4154, subsequently forming a continuous upward structure and breaking through the head and shoulders bottom pattern, reaching a high of around 4685.
The price has currently retreated from its high of 4685, breaking below the short-term support around 4546. However, the 4433-4392 area is gradually becoming a crucial defensive zone for this correction.
It's particularly noteworthy that the RSI has clearly entered oversold territory, indicating a rapid release of short-term selling pressure. For me, the biggest concern here isn't continuing to short, but rather a potential bullish reversal after gold completes its final bottoming process.
🎯 My Trading Strategy
I maintain my view of primarily buying on dips.
Focus on the 4435-4425 support level. If the price stabilizes here, consider building long positions in batches.
The key support level to watch is around 4390. A decisive break below 4390 would indicate a further expansion of this correction, necessitating a temporary abandonment of the bullish strategy.
The first resistance level to watch is 4545-4550. A break above this level would target 4620-4630. If the bulls recapture 4625, there's still a chance to retest the previous high of 4680-4690.
🏆 XAUUSD BUY: 4435-4425
🛑 SL: 4390
🎯 TP1: 4545
🎯 TP2: 4625
🎯 TP3: 4680
Personally, I prefer to interpret the current decline as a deep correction within an uptrend, rather than a complete trend reversal. With gold, the real opportunity isn't chasing the rally during periods of heightened sentiment, but rather waiting for the price to return to key support levels before looking for a renewed upward push.
⚠️ Of course, in the short term, close attention still needs to be paid to Fed policy expectations and US economic data. If inflation continues to be stronger than expected, gold may still experience significant volatility.
❤️ If you also believe in the future upside potential of gold, please like and follow my page to discuss gold market trends and trading strategies. Let's patiently wait for the next truly worthwhile opportunity to act! Long 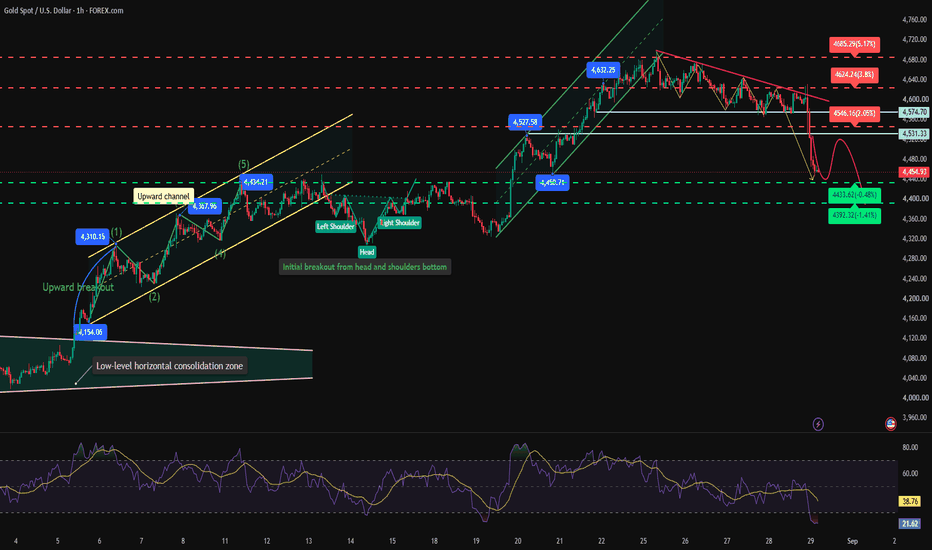
Why did gold prices plummet?How to interpret the opening trend?Gold Price Analysis for Next Monday:
Gold Technical Analysis: This week, gold prices rose to around 4697 before encountering resistance and falling back, resulting in a bearish weekly close. Next week, there is still room for further downward movement. The daily chart shows a large bearish candle, with yesterday's single-day drop approaching $200. Based on technical momentum, there is a possibility of further declines and new lows on Monday. However, Monday coincides with the monthly close, so we must be highly vigilant for a potential rebound to support the monthly close. An ideal monthly close would be around 4520. The "Evening Star" pattern formed at this week's high is further developing, indicating a significant release of short-term bearish momentum. However, after Friday's sharp decline, gold has quickly approached a key daily support area. The 20-day moving average (MA20) is currently around 4410. Therefore, at the beginning of next week, I suggest continuing to short around 4510.
The core strategy for gold next week remains bearish, with continued downside potential. Looking at the hourly chart, the Bollinger Bands are widening, the KDJ indicator has formed a bearish crossover with increasing volume, and the MACD fast line is below the slow line with the histogram bars gradually diverging. The short-term price has corrected as expected. Currently, a slight rebound is anticipated followed by a correction or a direct decline. We will focus on PMI and non-farm payroll data, as well as changes in intraday candlestick patterns, to make a final judgment. Once a bottoming signal appears, we will provide an accurate analysis. Please continue to follow our updates. In summary, the recommended strategy for gold trading next Monday is to primarily sell on rallies and secondarily buy on dips. The key resistance level to watch in the short term is 4500-4520, while the key support level is 4420-4400. Please keep up with the pace of the market.
Short 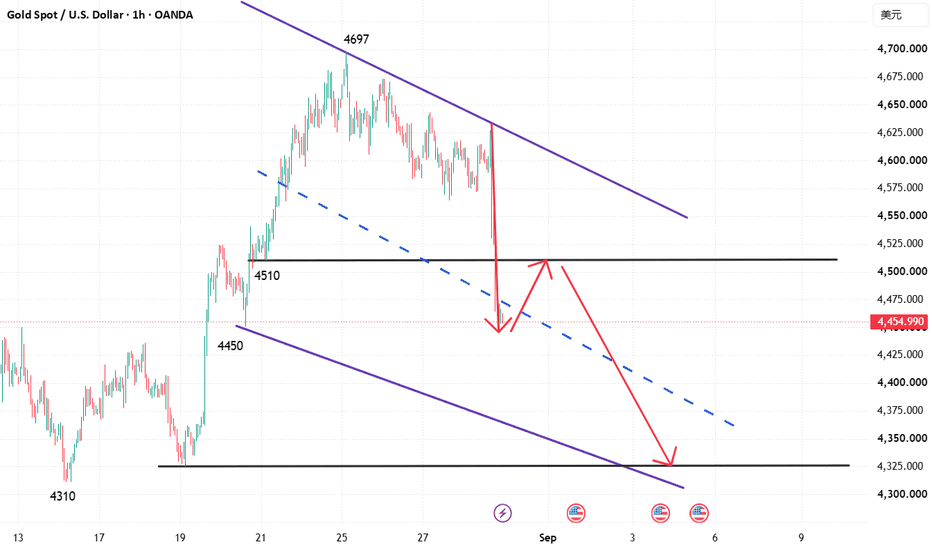
Short 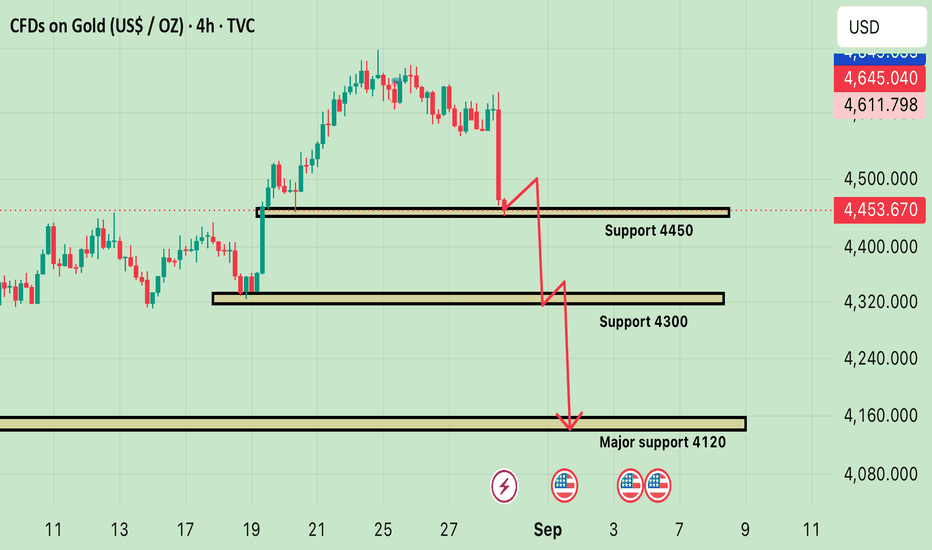
Long 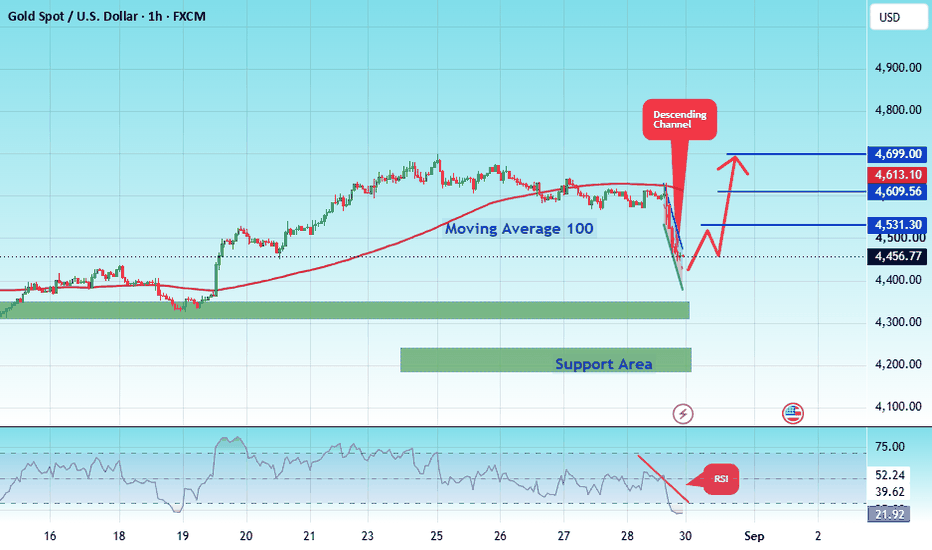
Short 
Trend Persistence and the Psychology of the Trailing Exit● 📊 The Conceptual Origin
- The Nick Rypock Trailing Reverse framework belongs to a family of trend-following overlays whose entire purpose is to answer one deceptively simple question: has the prevailing directional bias been invalidated, or is the current retracement merely noise within an intact structure. The concept emerged from a lineage of thinking that predates modern charting software, rooted in the observation that markets do not move in straight lines but in a sequence of impulsive legs punctuated by corrective pauses, and that a trader's greatest structural risk is not being wrong about direction but being slow to admit that direction has changed.
- Economically, the logic draws from the behavior of trend-persistence itself. Markets exhibit serial correlation over meaningful stretches of time because capital flows are rarely instantaneous; large participants build and unwind positions gradually, and this gradual unwinding creates observable footprints in the form of higher highs and higher lows during an uptrend, or the mirrored sequence during a downtrend. A trailing reverse mechanism is designed to ride this footprint for as long as it remains statistically valid, while stepping aside the moment the footprint breaks down.
- Psychologically, the framework responds to a universal trading affliction: the reluctance to exit a position once conviction has been established. Human beings anchor to their initial thesis and tend to rationalize adverse price action as temporary, which is precisely the blind spot that a percentage-based trailing structure is built to correct. By defining an objective, non-negotiable distance from the extreme price reached during the current trend leg, the framework removes the emotional negotiation from the exit decision entirely.
● 📈 Narrative Technical Analysis
- At its core, the mechanism constructs a dynamic reference line that trails price at a fixed percentage distance from the highest point reached since the current uptrend began, or from the lowest point reached since the current downtrend began. This is a critical distinction from volatility-scaled trailing stops that rely on an average true range multiplier: here, the offset is expressed purely as a percentage of price, which means the trailing distance breathes proportionally with the instrument's own price level rather than reacting to a separate measure of realized volatility.
- The calculation deliberately excludes information carried over from the prior trend. Once a reversal is confirmed, the extreme price that anchored the previous leg is discarded entirely, and a fresh extreme begins accumulating in the new direction. This creates a clean structural break in the reference line's memory, which is conceptually important: the framework never blends bullish and bearish extremes into a single continuous calculation, it treats each trend leg as its own discrete regime with its own anchor point.
- As price advances during an uptrend, the reference line ratchets upward each time a new peak is established, always maintaining the same fixed percentage cushion beneath the highest close or high recorded so far. It never retreats during this phase, meaning that even if price pulls back sharply without breaching the line, the trailing reference does not loosen or widen; it simply holds its most recently ratcheted position. This one-directional ratcheting behavior is what gives the mechanism its trend-locking character, similar in spirit to the way a chandelier-style exit locks in gains, though here the ratchet responds to percentage displacement rather than an average-true-range-derived buffer.
- A reversal is signaled the moment price closes beyond the trailing reference line, at which point the entire calculation flips: the line jumps to the opposite side of price and begins tracking the new extreme in the new direction. This binary, structural flip is what makes the tool function simultaneously as a trend filter and a stop-and-reverse mechanism, since the same calculation that defines the exit for the prior trend also defines the origin point for the next one.
- In terms of consolidation box mapping, sideways regimes reveal one of the framework's more nuanced behaviors. When price oscillates within a tight range, the trailing lines from both sides compress toward one another because neither extreme is being meaningfully extended, and the whipsaw frequency increases as price repeatedly tests both boundaries of the box. Volume profile anomalies often coincide with these compression zones, since thinning participation at the range extremes tends to precede the eventual breakout that resolves the consolidation.
● 🏦 Institutional vs. Retail Perspective
- Institutional desks tend to view a trailing percentage framework as a component within a broader execution and risk overlay rather than as a standalone signal generator. For a desk managing substantial notional exposure, the appeal lies in the mechanism's structural clarity and its ability to be back-tested and parameterized across a portfolio of instruments without requiring discretionary judgment calls at each juncture. Institutional users are typically more concerned with how the trailing distance interacts with liquidity conditions, since a percentage that is appropriate for a liquid large-cap equity may be entirely unsuitable for a thinly traded instrument where normal bid-ask friction alone could trigger premature reversals.
- Retail participants, by contrast, are drawn to the same mechanism for almost the opposite reason: its simplicity and its promise of removing emotional decision-making from the exit process. Where an institutional desk layers the tool within a multi-factor risk model, a retail trader more commonly treats the line itself as the entire trading plan, entering when a reversal is confirmed and exiting when the opposite reversal fires. This difference in application intensity creates very different risk profiles for the same underlying calculation.
- Another point of divergence concerns position sizing discipline. Institutional frameworks generally couple a trailing reverse signal with pre-defined capital allocation rules that scale exposure based on the width of the current trailing distance relative to account equity, whereas retail application frequently overlooks this relationship entirely, applying a static position size regardless of how far the trailing line sits from current price. This oversight is one of the more common sources of asymmetric drawdown among less experienced users of trend-following overlays generally.
● ⚙️ Strategic Variance
- In a trending regime, the framework performs closest to its conceptual ideal. Directional persistence with only shallow counter-trend pullbacks allows the trailing line to ratchet consistently in the direction of the trend, capturing the bulk of a directional move while only sacrificing the final portion of the move once the reversal condition is triggered. This is the environment for which the underlying logic was fundamentally designed, and it is where the mechanism's psychological promise of removing emotional exits delivers its clearest value.
- In a ranging regime, the same mechanism becomes considerably less forgiving. Because the trailing lines on both sides of price compress as extremes fail to extend meaningfully, the frequency of false reversal signals rises sharply. Each whipsaw within a consolidation box represents both a realized transaction cost and a psychological toll, since repeated small losses erode confidence in the framework even when the underlying logic has not itself failed, it has simply been applied in an environment poorly suited to trend-following mechanics.
- In a high-volatility regime, the behavior becomes more nuanced still. Because the trailing offset is a fixed percentage rather than an adaptive volatility measure, sudden expansions in realized volatility can cause the trailing distance to feel either too tight, triggering premature reversals on ordinary volatility spikes, or too loose, allowing an excessive give-back of unrealized gains before a genuine reversal is confirmed. This tension is a direct consequence of the percentage-based design choice rather than a flaw in the underlying concept, and it is precisely why practitioners often adjust the percentage parameter based on the historical volatility character of the specific instrument being traded.
● 🧠 Psychological Architecture
- The deployment of a percentage-based trailing framework is as much an exercise in psychological discipline as it is in mathematical calculation, because the tool's entire value proposition rests on the trader's willingness to honor its signal even when doing so feels premature or counterintuitive. The most common failure mode is not a defect in the calculation itself but the trader's own impulse to override the signal during a reversal, convinced that the trend will resume, which reintroduces precisely the emotional negotiation the framework was designed to eliminate.
- Loss aversion plays a distinct role here as well. Because the trailing line only ratchets in the favorable direction and never loosens, traders often develop an inflated sense of security around unrealized gains, treating the distance between current price and the trailing line as a permanent buffer rather than a probabilistic cushion that can be consumed rapidly during a sharp reversal. This overconfidence is a subtle cognitive trap, since the mechanism's one-directional ratcheting behavior can create the illusion of an ever-widening safety margin even as market conditions deteriorate.
- There is also a recency bias component worth addressing directly. Traders who experience a string of clean trending signals tend to overweight the framework's reliability and underweight the likelihood of an impending ranging phase, only to be caught off guard by a cluster of whipsaws that erode both capital and confidence simultaneously. Recognizing that regime shifts are inevitable, and that no fixed-percentage mechanism can adapt instantaneously to a change in market character, is a core component of using this type of tool responsibly over an extended horizon.
● 🎲 Risk & Probability Sagas
- The philosophical foundation of any trailing-based risk framework is inherently probabilistic rather than deterministic. No fixed percentage distance can be optimized to perform equally well across every possible market regime, and any attempt to curve-fit a single parameter to historical data risks producing a false sense of precision that dissolves the moment market character shifts. The honest framing is that the trailing percentage represents a trade-off between the frequency of premature reversals and the magnitude of give-back on a genuine trend exhaustion, and no parameter selection can eliminate both types of error simultaneously.
- This trade-off is best understood through the lens of asymmetric risk-to-reward construction rather than through any single performance metric viewed in isolation. A wider trailing distance reduces the frequency of false reversals but increases the average give-back on winning trades, while a tighter distance does the opposite, and the appropriate balance depends heavily on the volatility character of the specific instrument and timeframe under consideration, not on a universally optimal constant.
- Ultimately, the mathematical philosophy underlying this class of mechanism accepts that no individual signal can be judged in isolation. Performance emerges only across a sufficiently large sample of trend cycles, ranging phases, and volatility regimes, and any evaluation based on a handful of favorable trending examples is statistically meaningless. Position sizing, therefore, becomes the true governor of long-term survivability, since even a well-calibrated trailing percentage will produce a sequence of losing whipsaws during unfavorable regimes, and only sustainable capital allocation ensures the framework remains viable through that inevitable variance.
Based on the concepts previously discussed, the NRTR Adaptive Trailing Reverse indicator was developed to reflect the academic and technical principles outlined in this article.
● ⚠️ Risk Disclaimer
- This content is provided for educational and informational purposes only and does not constitute financial, investment, or trading advice. Trading and investing in financial markets involves substantial risk, including the potential loss of principal, and past performance of any concept, framework, or methodology discussed here is not indicative of future results. Market conditions are inherently unpredictable, and no analytical framework can guarantee outcomes or eliminate risk entirely. Readers should conduct their own due diligence and consult with a qualified financial professional before making any trading or investment decisions. Education 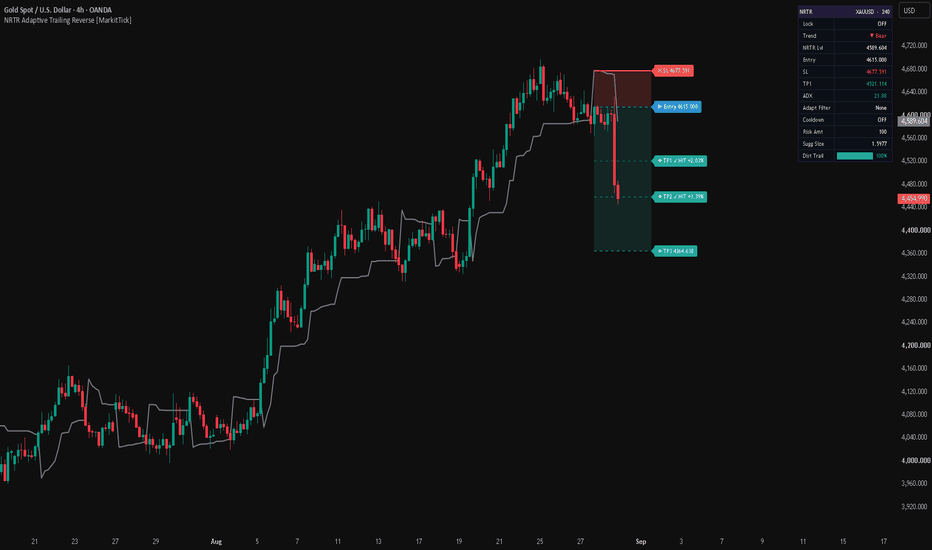
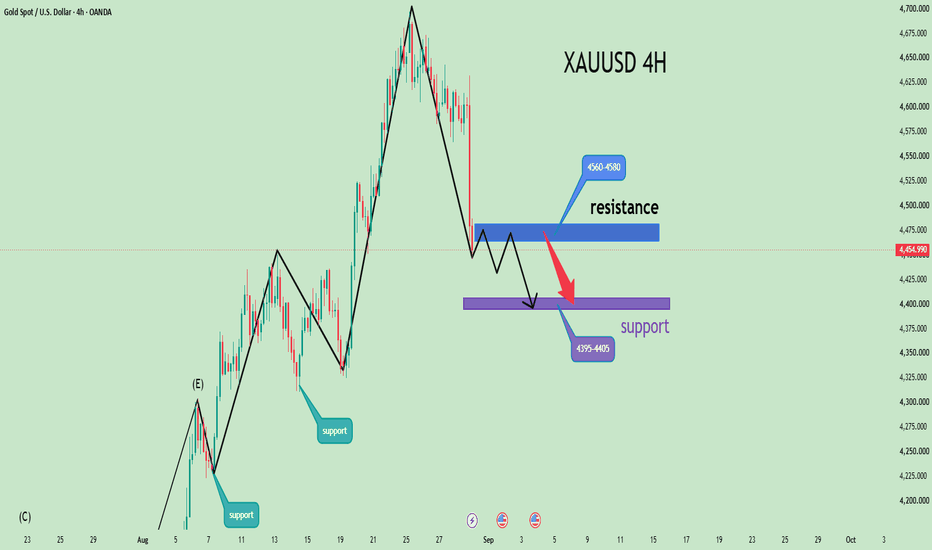
XAUUSD/GOLD WEEKLY SELL PROJECTION 30.08.26XAUUSD / Gold – Weekly Sell Projection
Gold has formed an Evening Star bearish reversal pattern on the weekly chart. Price then closed below the 4,551 neckline support, confirming increased selling pressure.
Current price: 4,454.990
Retest / Sell zone: 4,509–4,551
Minor resistance: 4,509
Major resistance (R1): 4,551
If price retests the broken support zone and shows bearish rejection, the downward move may continue.
Downside Targets
Target 1 – Support S1: Around 4,415
Target 2 – Support S2 / Fib 0.5: 4,325
Target 3 – Support S3 / Fib 0.618: 4,237–4,241
The major ascending trendline is near 4,241, so profit booking or a bullish reversal may occur there.
Confirmation
Consider a sell only after bearish rejection, a bearish engulfing candle, or a lower-timeframe structure breakdown within the 4,509–4,551 zone. Avoid chasing the price if it falls directly.
Invalidation
A strong weekly close above 4,551 would weaken the bearish outlook. Sustaining above 4,600 could invalidate the sell projection.
Overall bias: Bearish below 4,551, with the main downside target around 4,241. Short 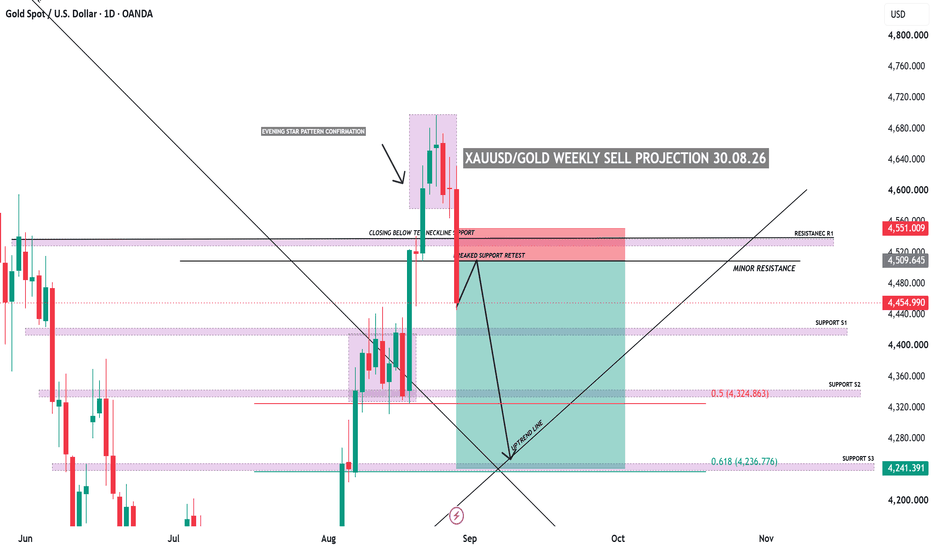
XAU/USD Daily Outlook: Rejection at Bearish OB Points to FVG RetXAU/USD (Gold) Daily Timeframe: Rejection at Bearish Order Block & Multi-Leg Structural Projection
**Signal Summary**
* **Asset Pair:** XAU/USD (Gold Spot / U.S. Dollar)
* **Timeframe:** Daily (1D)
* **Trade Direction:** Short (Primary Swing) / Long (Secondary Retest)
* **Entry Zone:** 4,640.00 – 4,680.00 (Inside Bearish Order Block)
* **Stop Loss (SL):** 4,720.00 (Above the Bearish OB high)
* **Take Profit (TP):** TP1: 4,538.76 (Intermediate Support) | TP2: 4,150.00 (Bullish FVG Zone)
* **Risk/Reward Ratio:** ~1:2.5 (TP1) to 1:4.8 (TP2)
---
**Detailed Technical Breakdown**
* **Bearish Order Block Rejection:** Price has rallied into a key daily Bearish Order Block (Bearish OB) between 4,640.00 and 4,700.00. The long upper wick on the current daily candle signals strong supply and selling rejection at this zone.
* **Dynamic Resistance & Horizontal Support:** The 100-day Exponential Moving Average (100 EMA, sitting near 4,343.27) cuts through the chart structure, while the immediate horizontal floor sits at **4,538.76**.
* **Bullish Fair Value Gap (FVG) Target:** Below the intermediate support lies a significant unmitigated Bullish Fair Value Gap (Bullish FVG) spanning **4,100.00 – 4,220.00**.
* **Projected Multi-Leg Path:**
1. **Leg 1 (Bearish Push):** Rejection from the Bearish OB down toward the 4,538.76 support level.
2. **Leg 2 (Deeper Expansion):** Extension down into the 4,150.00 Bullish FVG region.
3. **Leg 3 (Macro Bullish Reversal):** Anticipated long-term bounce out of the Bullish FVG toward higher structural targets.
---
**Trade Management & Execution**
* **Execution Trigger:** Enter short on market execution or upon a daily/4H candle close below 4,640.00 confirming supply dominance inside the Bearish OB.
* **Position Management:** Move Stop Loss to breakeven once price breaks below the key **4,538.76** horizontal support line. Scale out partial profits at TP1 (4,538.76) and hold the remainder for the Bullish FVG zone (4,150.00).
---
**Disclaimer**
*This post is strictly for educational and informational purposes and does not constitute financial advice. Trading forex and commodities involves high risk. Always manage your capital responsibly.*
---
#XAUUSD #GoldTrading #SmartMoneyConcepts #DailyAnalysis #BearishOB #FairValueGap #TradingView #ForexSignals #PriceAction Education 
 Long
Long
XAU RoadmapHello there!
"The overall trend (big picture) remains bullish, and the main drivers are the tense geopolitical conditions expected in the coming months — as Russia is anticipated to carry out new actions in Europe to test NATO and divert its focus away from Ukraine.
On the other hand, U.S. debt and borrowing cost concerns could lead to economic uncertainty, which in turn would support gold.
The recent rally in spot gold was driven by the news of an increased U.S. debt buyback ceiling, which coincided with falling yields — leading markets like crypto and gold to experience such upward moves.
Going forward, we have two scenarios, both ultimately targeting levels above $5,000:
· Either price is in wave 3 of a 5-wave Elliott structure, and after completing a correction around the yellow box area, it continues its upward move.
· The red scenario gets activated if price drops below $4,200. In that case, as indicated by the arrow, after hitting the channel bottom around $3,700–$3,800, it could rally toward $5,000+ targets.
For now, the base case is the first scenario — unless price breaks below $4,200."
NFA-DYOR
#Javanshir_Academy
#Retrader XAUUSD: Buy-Side Liquidity Sweep & Market Maker Buy Model | BullXAUUSD — Buy-Side Liquidity Sweep & Market Maker Buy Model
Gold is showing a structured liquidity-driven bullish move, with price developing through accumulation, consolidation, a liquidity trap, and a strong expansion toward the buy-side liquidity
The market first established a period of consolidation where liquidity gradually built around the range. Price then moved lower and swept the previous lows, creating a clear sell-side liquidity grab. The bearish move was followed by a strong bullish reaction, indicating a shift in short-term order flow
The bullish displacement pushed price back through previously traded levels and created an imbalance during the expansion. This was followed by another period of consolidation, where price stabilized before eventually breaking higher
The final bullish expansion took price toward the 2710–2711 region, completing the liquidity-driven move highlighted in the chart
The overall sequence can be viewed as accumulation, liquidity formation, sell-side liquidity sweep, bullish displacement, imbalance, consolidation, and buy-side liquidity expansion
For future price action, the focus remains on how Gold reacts around previous highs, lows, liquidity pools, and imbalance formations. Continued acceptance above the recent highs could support further bullish momentum, while a loss of the established bullish structure could lead to a deeper retracement
This analysis is based on price action, liquidity and market structure concepts shown on the chart. It is for educational purposes only and should not be considered financial advice or a guaranteed trade setup. Long 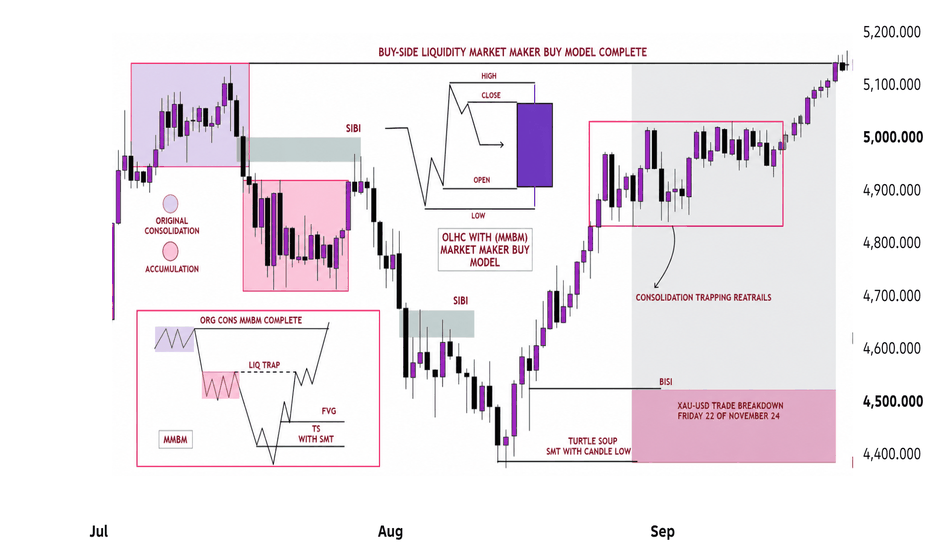
XAU/USD — 4H ORDER BLOCK REVERSAL SETUPGold has rallied aggressively and is now entering a 4H Order Block / Premium Supply Zone around 4,670–4,725.
🔴 BEARISH SCENARIO
Price is currently testing the upper supply area after an extended bullish move. If buyers fail to secure a strong 4H close above the OB, we could see a liquidity-driven correction.
📍 Supply / 4H OB: 4,670 – 4,725
🎯 Target 1: 4,550
🎯 Target 2: 4,500
🎯 Target 3: 4,450 — Sell-Side Liquidity
🛑 Invalidation: Strong 4H close above 4,725
🧠 SMC LOGIC
4H OB → Liquidity Sweep → Rejection → Bearish Displacement → Sell-Side Liquidity
The key is confirmation. I would not blindly short the first touch. Wait for rejection, bearish displacement and/or a market-structure shift on the lower timeframe.
⚠️ If price breaks and holds above 4,725, the bearish setup becomes invalid and bullish continuation could take control.
Bias: 🔻 Short-term Bearish Correction
HTF Trend: 🟢 Bullish
Risk: High volatility near the supply zone.
Not financial advice. Always manage risk.
#XAUUSD #Gold #GoldTrading #Forex #SMC #SmartMoneyConcepts #PriceAction #OrderBlock #Liquidity #TradingView #ForexTrading #TechnicalAnalysis Short 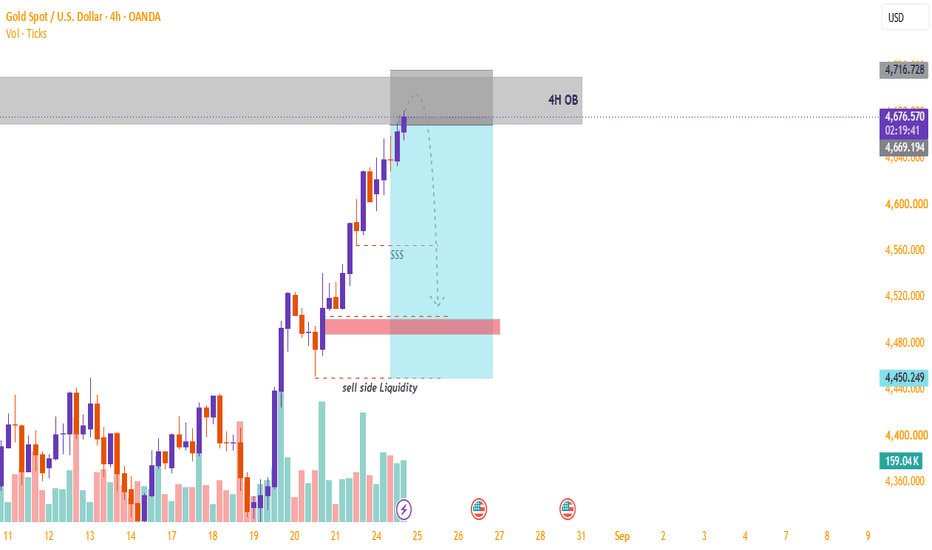
XAU/USD | GOLD MARKET UPDATE
🔥🏆 XAU/USD | GOLD MARKET UPDATE
Gold has now spent three consecutive sessions consolidating near the highs. While the range has offered short-term opportunities, Jackson Hole is approaching, so I believe we need to be more selective.
Today, Gold once again tested 4643 and was rejected, then broke below 4600, broadly following the descending-channel structure I have been tracking.
For me, the key point is that Gold has not found enough fresh momentum to escape the current range. This increases the probability of another short-term correction.
📊 MARKET STRUCTURE
Since the 4696 high on August 25, Gold has been trading inside roughly:
📦 4600–4640
The 4700 area has been tested twice without a successful breakout, creating a potential double-top structure, although it is not confirmed yet.
I still classify the current move as:
High-level consolidation and profit-taking — NOT a confirmed trend reversal.
The daily bullish structure remains intact, while the weekly chart has already broken above the previous five-month descending resistance line.
Therefore, I am not interested in blindly calling a major top before the market actually confirms one.
📉 TECHNICAL ANALYSIS
The hourly descending channel has been one of my main references over the past few sessions.
Today’s decline followed this structure closely, with Gold eventually falling toward 4564.
This is important because I previously highlighted:
🟢 4560–4570 = key support / potential BUY zone
The market has now reached this area, validating the importance of this level.
🎯 KEY LEVELS
🔴 4700 — Major resistance / breakout level
🔴 4670–4650 — Strong resistance
🔴 4633 — Short-term resistance
🔴 4605 — Immediate resistance
🔴 4590–4600 — Short-term sell zone
🟢 4570–4560 — Key support
🟢 4540–4530 — Strong support
🚨 4500 — Major trend support
The 4H MACD remains elevated but has not yet developed a major bearish crossover.
This suggests the market may still be correcting momentum through consolidation rather than completely reversing the trend.
🌎 FUNDAMENTAL BACKDROP
The latest PCE data failed to provide Gold with the fresh bullish catalyst needed to break out of the current range.
Meanwhile:
📈 USD Index has moved back above 99
📊 September rate-hike expectations remain around 40–42%
🏛️ Jackson Hole is approaching
Therefore, short-term Gold remains vulnerable to additional pressure.
The upcoming Jackson Hole speech is now one of the most important catalysts for the next directional move.
Until then, I expect volatility, fake breakouts and repeated tests of support and resistance.
🧠 MY PERSONAL VIEW
Today's decline actually strengthens my preference for a sell-the-rally / buy-the-support strategy.
I don't want to chase Gold lower after the price has already moved toward 4570.
Instead, I want to see how price reacts around the key levels.
If Gold rebounds toward:
4590–4600
I will look for another short-term short opportunity if clear rejection appears.
Above that:
4605 → 4620 → 4633 → 4650
These levels will determine whether buyers can regain control.
At the same time, 4560–4570 remains extremely important.
If buyers defend this zone, Gold could rebound toward 4590–4630.
However, if 4560 breaks decisively, the correction could accelerate toward:
🎯 4540–4530
The bigger structural level remains 4500.
A daily close below 4500 would significantly weaken the medium-term bullish structure.
🔥 XAU/USD | TRADING PLAN
🔴 SELL SETUP — PRIMARY
⬇️ SELL: 4595–4600
🛑 SL: 4620
🎯 TP1: 4560
🎯 TP2: 4530
If 4560 breaks with strong momentum, consider holding for further downside.
🟢 BUY SETUP — SUPPORT REACTION
⬆️ BUY: 4560–4570
⚠️ Wait for bullish confirmation.
🎯 TP1: 4590–4600
🎯 TP2: 4620
🎯 TP3: 4633
If 4560 breaks decisively:
🚫 Do not blindly buy the dip.
Wait for 4540–4530.
🎯 MY ROADMAP
4670 → 4650 → 4633 → 4620 → 4590
This remains my preferred short-term bearish path.
But I will not chase the downside.
If Gold reaches 4560–4570 and buyers step in, I will reassess for a long.
If 4560 fails, the next area I will watch is 4530.
And if 4500 eventually breaks on a daily closing basis, the medium-term structure must be reassessed.
🏆 FINAL VIEW
📈 Long-term: Bullish
📦 Short-term: High-level consolidation
🔴 Resistance: 4650–4700
🟢 Support: 4560–4570
🚨 Major support: 4500
My strategy is simple:
Sell the rally. Don't chase the drop. Buy confirmed support.
Trading is not about predicting every move. It is about waiting for price + level + confirmation + risk management.
❤️ LIKE if you agree with my analysis.
➕ FOLLOW for more XAU/USD trading setups.
💬 COMMENT: Will 4560–4570 hold again, or will Gold break toward 4530?
Trade the levels. Follow the trend. Protect your capital. 📊🔥🏆 Long 
Core Bearish Logic for the Coming WeekCore Bearish Logic for the Coming Week
1. Hawkish signals from Jackson Hole and market repricing of rate-hike risks are the primary drivers of bearish sentiment.
Officials have clearly stated that the inflation issue remains unresolved and the option for further rate hikes is being kept on the table. Consequently, the probability of a September rate hike (according to the CME FedWatch Tool) has surged, and real yields on US Treasuries have risen. As a non-yielding asset, gold faces higher opportunity costs for holding in an environment of high—or potentially rising—interest rates, which suppresses prices. Speculative capital continues to flow out of the precious metals market, leaving bearish forces in short-term control.
2. The unwinding of significant accumulated long positions and stop-loss orders suggests downward momentum is not yet exhausted.
A strong short-squeeze rally in August built up massive long positions; last Friday’s sharp drop triggered widespread stop-loss orders, leading to a "long-on-long" liquidation spiral. The 4-hour MACD has formed a bearish "death cross" and the RSI has retreated without yet entering deep oversold territory; this indicates room for further short-term bearish momentum, making rebounds prone to stalling and facing heavy selling pressure at higher levels.
3. Multiple resistance levels have formed overhead, creating significant hurdles for any rebound.
Previous key support levels at 4500, 4550, and 4600 have flipped into strong resistance levels following the breakdown. Without a major positive catalyst, any price rebound into these zones will likely trigger concentrated selling from investors trapped in earlier long positions and those taking profits, thereby limiting the upside. Reversing the short-term bearish trend requires reclaiming and stabilizing above the 4600 level—a feat that appears difficult to achieve in the near term.
4. The US Dollar Index is supported by policy expectations.
Rising expectations for rate hikes are bolstering the US dollar, placing direct pressure on dollar-denominated gold. As long as the market anticipates a "higher-for-longer" interest rate environment, the dollar is likely to remain strong, continuously suppressing gold's potential for a rebound. Short