NQ — week of August 31 – September 4, 2026: LongLAST WEEK: "I sell into the 29,644 weekly pivot, aimed at the 28,946 shelf." The week did both jobs: 28,946.75 printed, three quarters of a point from the call, and Friday settled 29,491 — the parked short cashing +270 pts (still pritty OK, or ;-) at the bell. Thursday's close over the line killed the thesis on paper; the P&L never read the obituary.
Long — Thursday's settle killed my short by its own rule — a daily close back over the line, the exact out I published — and the rule outranks the writer. Then the week absorbed a blowout quarter and the sternest Fed speech in years, and still closed above its pivot. The 28,946 floor has been bought twice now, hard, both times inside a session. I don't pay for the middle after that. The bid goes to the 29,022 shelf; a daily settle under 28,946 and this idea joins the short in the archive.
THE BIG PICTURE (weekly)
Last week took the best earnings news of the cycle and a Fed openly talking itself toward a hike, and netted about a hundred points. Maximum news, minimum movement — a market telling you both stories are priced; it parked on this week's pivot to prove it. Underneath, money leaving the broad market concentrates into the few names that are this index: thinning breadth everywhere else is, mechanically, a bid under the Nasdaq. Concentration climbs the stairs — and takes the elevator down when it lets go.
THE SWING (daily)
Monday of last week hit the shelf in one session, and every day after closed higher — supply had its chance and never showed. Friday's rejection left a lid, but beneath it the daily chart rebuilt its staircase, and the shelf now carries two floors inside ninety points. The macro leg is the strange one: rates are pricing a September hike against payrolls that printed negative. One of those positions is wrong, and Friday names which.
THE WEEK'S MAP (4H)
Upside: 29,545 — the overnight ceiling, first door up → 29,811–29,887 — the lid: last week's high and R1 seventy-five points apart, the proof level → 30,062–30,094 — the July band, the standing scar → 30,281 R2 — under the 30,343 summer roof → 30,751 R3 — Friday-only territory.
Downside: 29,417 — the weekly pivot the tape parked on → 29,274 — the overnight low, first crack → 29,022 S1 — the shelf top over round 29,000, my bid → 28,946 — two floors inside ninety points; a settle below ends the conversation → 28,552 S2 — the 28,408 low and 28,314 stair beneath.
One number all week: 29,417. The pivot the tape parked on. My bid at 29,022 works above it — shelf to lid is eight hundred points, inside one weekly ATR; a daily settle under 28,946 kills it and opens 28,552.
THE CATALYSTS (CT)
Mon 31 — Nothing Tier-1. The range trades its own inventory.
Tue 1 — ISM manufacturing and job openings 09:00 CT; Dell, Palo Alto after the close. The hike math loads.
Wed 2 — ADP 07:15 CT, Beige Book 13:00 CT; Broadcom after the bell — the AI trade's next witness.
Thu 3 — Claims 07:30 CT, ISM services 09:00 CT. Last positioning day before the print that matters.
Fri 4 — Payrolls, wages, unemployment 07:30 CT. A hike priced against a negative jobs print — one folds here.
BOTTOM LINE
Maximum news, minimum movement — I take the hint: this stays a range until Friday says otherwise, and ranges pay the trader who does business at the rails. My bid rests at 29,022 with two floors beneath it; the lid at 29,811 is where longs get paid, not where they get born. A daily settle under 28,946 closes the book — I don't renegotiate with a settle.
Not advice — trade your own plan.  Long
Long
 Long
Long
Long 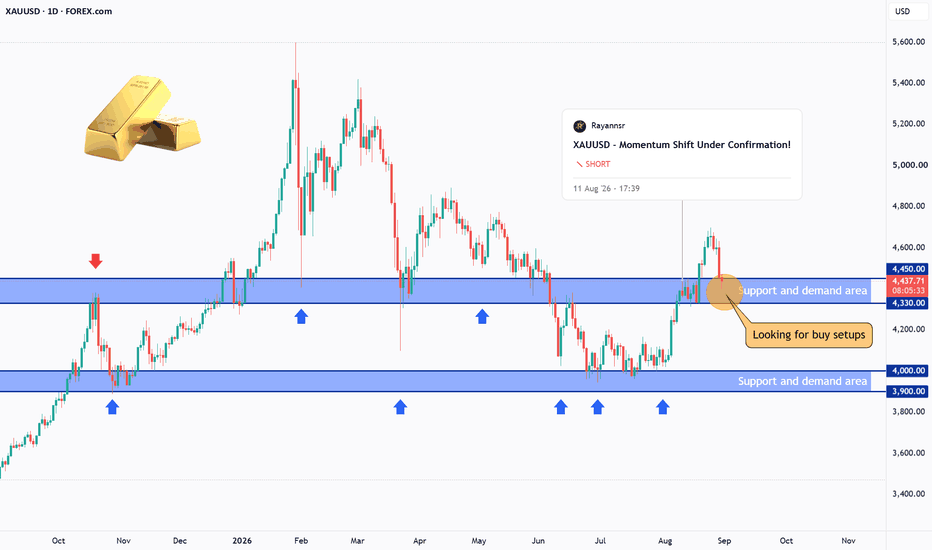
Short 
Gold presses the first shelf above VWAP after the breakdownXAUUSD, M15, read at 2026-08-31 12:15 UTC, just before the New York open.
Structure first. The M15 EMAs are still fully inverted (25 at 4448.19, 100 at 4476.69, 200 at 4517.27) after the drop out of the 4600s, and the higher timeframe value area sits far above the market, roughly 4545 to 4645. Nothing about that has repaired yet.
What has changed is the near term. Price at 4457.18 is back above VWAP at 4441.04, above the M5 EMA 25 and EMA 100, and is now pressing into the first real shelf: the master POC at 4458.33 with the M5 EMA 200 at 4459.06 sitting on top of it, and a small ledge at 4461.9 above that.
Levels I am watching, taken from the Master Volume Profile:
Above: 4458.33, then 4461.9, then 4476.7.
Below: 4451.6, then 4446.8, then 4441.04.
Two ways this resolves. Acceptance above 4461.9 puts 4476.7 in play, which is where the M15 EMA 100 currently sits. A rejection at 4458 to 4462 sends it back to 4451.6 and the 4441 VWAP shelf. Between those two rails there is no edge worth taking, and Net Vol reading saturated buy on low liquidity is a reason to treat the push as absorbed rather than fresh demand.
I would consider the recovery read wrong on a close back under 4439.26.
Context: bond yields are at multi-year highs and Fed rate-hike bets have risen, while Middle East escalation feeds inflation anxiety. Gold dipped on the rate repricing but is still heading for its best month since January. It is also month end.
Levels drawn with the KenKem Master Volume Profile indicator and strategy.
Technical analysis only, for education. Not financial advice.
Short 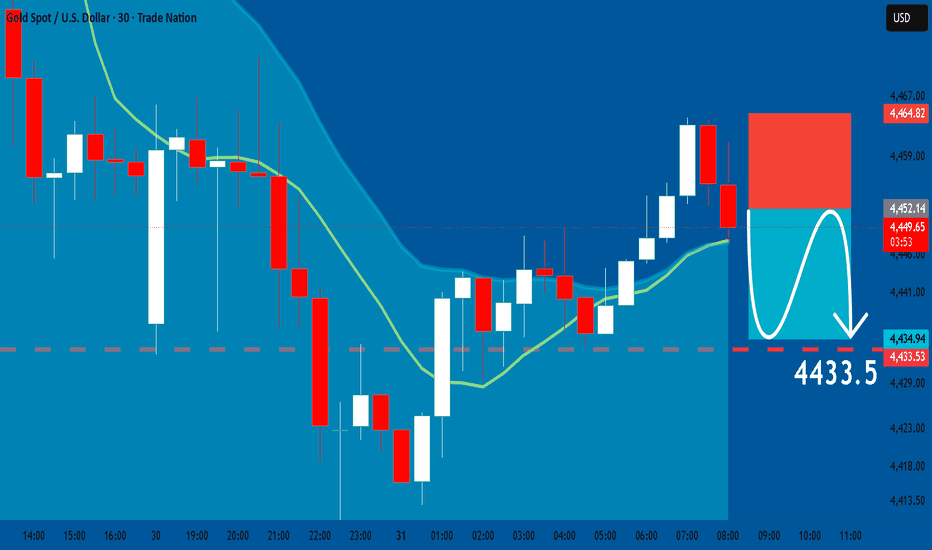
XAUUSD: The Fall Is Easy. The Re-entry Is Where It Gets HardGold has already made the dramatic move.
From above 4,600, XAUUSD collapsed through 4,570, 4,520 and 4,480 before reaching the 4,420–4,440 area. On H1, that changes the conversation completely.
I am no longer asking whether sellers are strong.
They clearly are.
The useful question now is: where would I actually want to join them?
Because selling after a vertical drop is usually where a good bearish idea turns into a bad entry.
I HAVE TWO BOXES ON MY SCREEN
The first is 4,420–4,440.
This is where the current selloff has arrived, and it is the only area where I would consider a countertrend long. But touching the box is not enough.
I need Gold to prove that sellers are losing control.
An H1 candle sweeping below 4,420 and then closing back above 4,440 would be my first signal. If the following candles can defend 4,435–4,440, I have a trade.
BUY 4,435–4,445
SL 4,412
TP1 4,475
TP2 4,505
TP3 4,525
This is not me calling the bottom.
It is simply a rebound trade after an oversized bearish move.
And 4,520–4,545 is exactly where that rebound becomes interesting for the other side.
THAT SECOND BOX BELONGS TO SELLERS
Look at what happened during the decline.
Price did not gently move below 4,520.
It cut through it.
That means any recovery toward 4,520–4,545 would bring Gold back into the origin of the latest acceleration lower, while also returning price toward the 0.5–0.618 retracement area shown on the chart.
For me, this is much better territory to look for shorts than 4,430.
If Gold rebounds into the zone but an H1 candle rejects it and closes back below 4,520, I would look to sell the failed recovery.
SELL 4,518–4,530
SL 4,552
TP1 4,480
TP2 4,440
TP3 4,415
The logic is simple enough for anyone new to trading:
The trend is bearish, but I want sellers at a better price.
THERE IS ONE WAY GOLD CAN RUIN THAT SHORT
Take back 4,545.
Not with a wick.
I want an H1 close above it, followed by a pullback that stays above approximately 4,525.
If that happens, the market has done something important: it has recovered an area sellers were supposed to defend.
Then I stop treating every bounce as a selling opportunity.
BUY 4,528–4,540
SL 4,505
TP1 4,575
TP2 4,610
TP3 4,655
The 4,655–4,675 order block would then become the larger upside destination.
WHAT IF GOLD NEVER BOUNCES?
Then I do nothing until 4,420 breaks properly.
An H1 close below 4,420 followed by a weak retest from underneath would tell me the market is accepting another lower price range.
That gives me the continuation setup:
SELL 4,415–4,425
SL 4,447
TP1 4,390
TP2 4,365
TP3 4,330
No retest, no chase.
Gold has already fallen far enough to punish traders who arrive late.
So my map today is unusual:
Around 4,430, I am watching sellers for exhaustion.
Around 4,530, I am watching buyers for exhaustion.
Everything in between is travel.
The best trade may not come from predicting Gold's next candle. It may come from waiting until price reaches the place where the risk finally makes sense.
Would you rather buy the exhaustion near 4,430, or wait for sellers around 4,530? Short 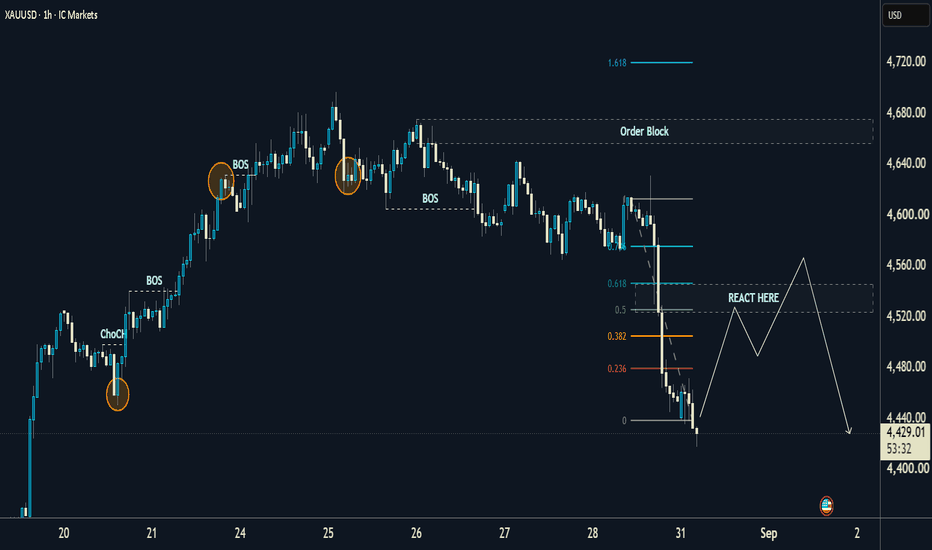
Gold Analyze todayAnalyzing the provided gold chart on a 4-hour (H4) timeframe involves a more detailed look at the shorter-term price movements and identifying support and resistance levels accordingly.
### Analysis on H4 Chart
**Key Observations:**
- **Recent Highs and Lows:**
- Highs around 2,370 and 2,360
- Lows around 2,280 and 2,290
- **Current Price:** The current price is 2,343.87.
### Support and Resistance Levels
**Resistance Levels:**
1. **Around 2,360**: This level has been tested multiple times in June and early July and has held as a resistance level.
2. **Around 2,370**: This is another key resistance level where the price faced rejection in mid to late June.
3. **Around 2,350**: The current price is approaching this level, which has acted as resistance in the recent past.
**Support Levels:**
1. **Around 2,310 - 2,320**: This level has provided support in late June and early July.
2. **Around 2,280 - 2,290**: This is a significant support level, as it has been tested multiple times and held strong, preventing the price from dropping further.
3. **Around 2,300**: Another level where the price found support in late June.
### Trend Analysis
- **Upward Trend:** The recent price movement indicates a potential upward trend as the price is making higher lows.
- **Range-bound Movement:** The price has been trading in a range between 2,280 and 2,370 for the past few weeks, indicating a consolidation phase.
### Moving Averages
Including moving averages can provide additional insight into the trend:
- **50-period MA**: The 50-period moving average can act as a dynamic support or resistance level.
- **200-period MA**: The 200-period moving average provides a longer-term trend indication.
### Technical Indicators
- **RSI (Relative Strength Index)**: Checking the RSI can help identify overbought or oversold conditions.
- **MACD (Moving Average Convergence Divergence)**: Analyzing the MACD can help identify potential buy or sell signals.
### Conclusion and Recommendations
- **Current Price Action:** The price is currently testing the 2,350 resistance level. A break above this level with strong volume could indicate a continuation of the upward trend.
- **Next Resistance:** If the price breaks above 2,350, the next resistance levels to watch are 2,360 and 2,370.
- **Support Levels:** If the price fails to break above 2,350, it may fall back to test the support levels at 2,320 and 2,300.
- **Trading Strategy:**
- **Bullish Scenario:** Enter a long position if the price breaks above 2,350 with strong volume, targeting 2,360 and 2,370.
- **Bearish Scenario:** Enter a short position if the price fails to break above 2,350 and starts to decline, targeting support levels at 2,320 and 2,300.
This analysis provides a comprehensive view of the gold price movement on the H4 timeframe, focusing on key support and resistance levels and considering recent price action to inform potential trading strategies. GOLD STRUCTURE +H3/H4 EMA 200 strategy Shavyfxhub Strategy Analysis – Gold Spot / USD (4H – OANDA)
Shavyfxhub trades pure market structure using:
• Demand floors (green zones) → areas of strong institutional buying that previously launched rallies.
• Supply roofs (red zones) → areas of strong institutional selling that previously launched drops.
• Higher-timeframe (especially H4) closes to confirm new roofs/floors.
• Trade impetus points (A, B, C) often identified during the Asian session.
• Classic patterns such as double tops + necklines.
• Confluence with the 200EMA as a dynamic demand floor.
• Clear trendlines/channels for bias.
He prioritizes structure over indicators and waits for confirmed closes or reactions at these zones.
Current Structure Breakdown
1. Larger Uptrend Context
Price is still inside a broad ascending channel (red & green trendlines) that started from the late-July / early-August lows. Point A and point B marked earlier successful demand-floor reactions that produced the strong rally during Asian session and running into London and newyork.
2. Double-Top Distribution
• Mid-August double top with a clear neckline.
• Larger double top near the recent highs (~4,680–4,700 zone).
These created the distribution that led to the sharp sell-off we saw last week. Key Levels to Watch (Shavyfxhub style)
• Immediate supply roof: ~4,474 (red box)
• Immediate demand floors: 4,432 – 4,455 and 4,356 – 4,370
• Stronger demand floor + 200EMA: ~4,309
• Higher structure resistance: previous double-top area and the ascending red trendline
Summary in Shavyfxhub Terms
The market has completed a textbook double-top distribution after the A/B impulse. Price is now testing the next demand-floor cluster. The structure remains constructive as long as the demand floors (especially the 200EMA confluence) hold. A clean H4 break and close below the current demand floors would open the path toward the lower demand zones and shift short-term bias fully bearish.
This is pure structure-based analysis — no indicators needed beyond the 200EMA for confluence. Wait for the next H4 close relative to the marked roofs and floors for the next high-probability impetus. Long 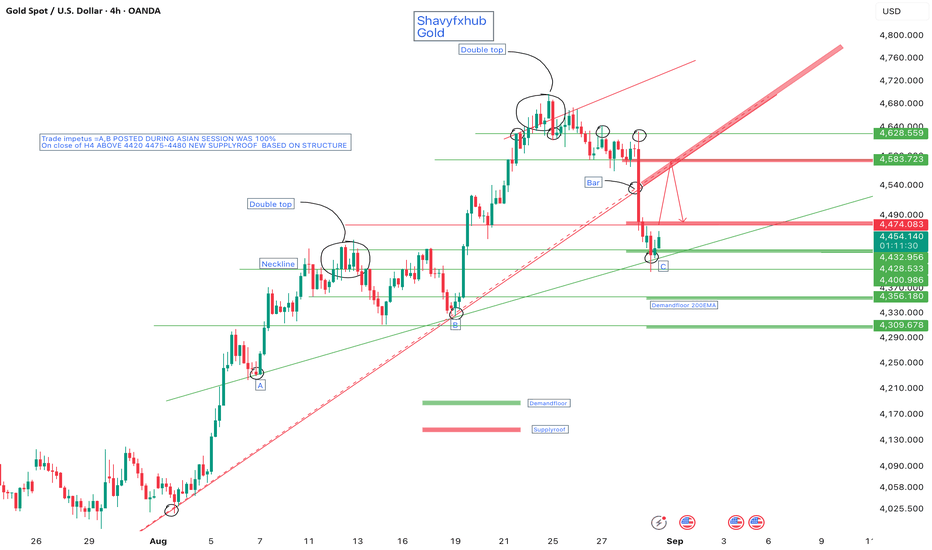
 Long
Long
Support Holds, Recovery Wave in Focus
Fundamental Analysis
Gold remains under pressure from a firm U.S. dollar and higher Fed rate expectations. However, renewed geopolitical tension may provide some safe-haven support. U.S. employment data this week could become the next major catalyst.
Technical Analysis
On H1, Gold has reacted from the 4,400–4,425 OB + Support after the recent strong sell-off.
Price is now recovering near 4,464. The first upside test is the 4,517–4,540 Fibo Zone. If buyers reclaim this area, the recovery could extend toward the high-volume region around 4,590–4,610 and eventually the 4,630–4,650 BSL.
Important Key Levels
4,630–4,650 — BSL / Resistance
4,590–4,610 — Volume Profile Resistance
4,517–4,540 — Fibo Zone
4,400–4,425 — OB + Support
Trading Scenario
Buy priority remains while 4,400–4,425 holds and H1 continues showing bullish recovery.
Target: 4,517–4,540 first, then 4,630–4,650 if momentum strengthens.
Invalidation: H1 acceptance below 4,400.
Overall View
Gold is still weak on the broader short-term structure, but the reaction from major support may develop into a corrective recovery. The Fibo Zone is the first important test for buyers.
Can Gold reclaim 4,540 and extend the rebound toward upper liquidity? Long 
XAUUSD: Hawkish Fed Pressure hits GoldGold remains under pressure after a sharp repricing of Fed expectations following Kevin Warsh’s hawkish Jackson Hole message. Market reports showed gold falling toward a near two-week low as traders increased the probability of a September Fed rate hike.
This is negative for gold because higher rates and firmer Treasury yields increase the opportunity cost of holding a non-yielding asset.
The second pressure point is oil and inflation risk. Renewed U.S.-Iran tensions pushed oil higher, making the inflation story more complicated. Normally, geopolitical stress can support gold as a safe-haven asset. But this time, the market is focused more on the Fed reaction: higher inflation risk may mean tighter policy, not easier policy.
ETF headlines confirm the same short-term pressure. Gold and silver ETFs saw broad selling, with Moneycontrol reporting declines of up to 3.5–4% across precious-metal products. That shows investors are not only reacting in spot gold, but also reducing exposure through ETF instruments.
On the chart, XAUUSD broke below the $4,510 support area and is now trading near $4,443. Price is below EMA 9, EMA 20, SMA 50 and SMA 200, so the short-term structure is clearly bearish.
RSI is near 33, meaning gold is weak and already close to oversold conditions. That can create short-term bounce risk, but it does not cancel the breakdown.
Possible price movement
If XAUUSD stays below $4,510, sellers remain in control and the next downside areas are $4,420, then $4,385–$4,360.
If gold bounces, the first test is $4,510. A stronger recovery would require a move above $4,545–$4,558.
If buyers reclaim $4,558, the chart can start looking constructive again, with recovery potential toward $4,600 and then $4,685.
Gold is still supported by long-term macro uncertainty, but short-term momentum is bearish after hawkish Fed repricing. A recovery above $4,510 is needed before buyers can regain control.
Not financial advice. Long 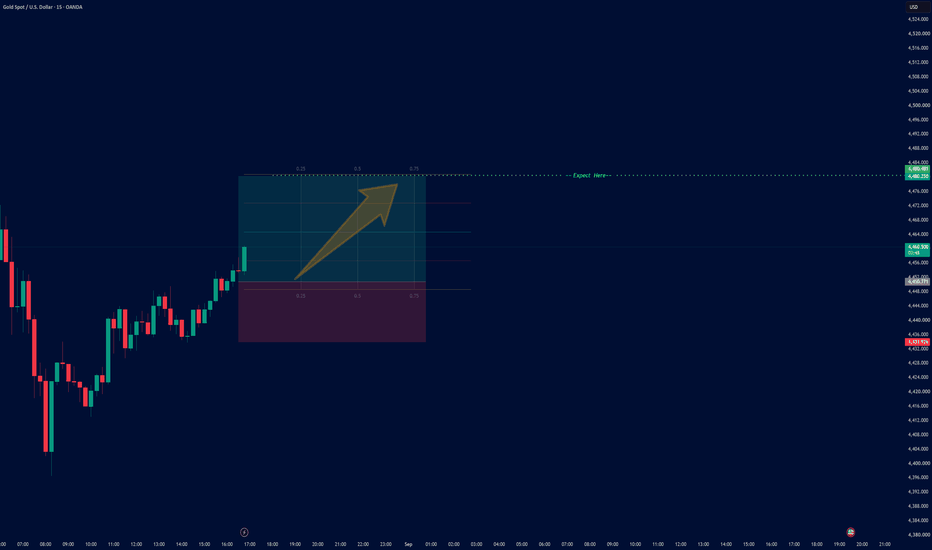
 Short
Short
Long 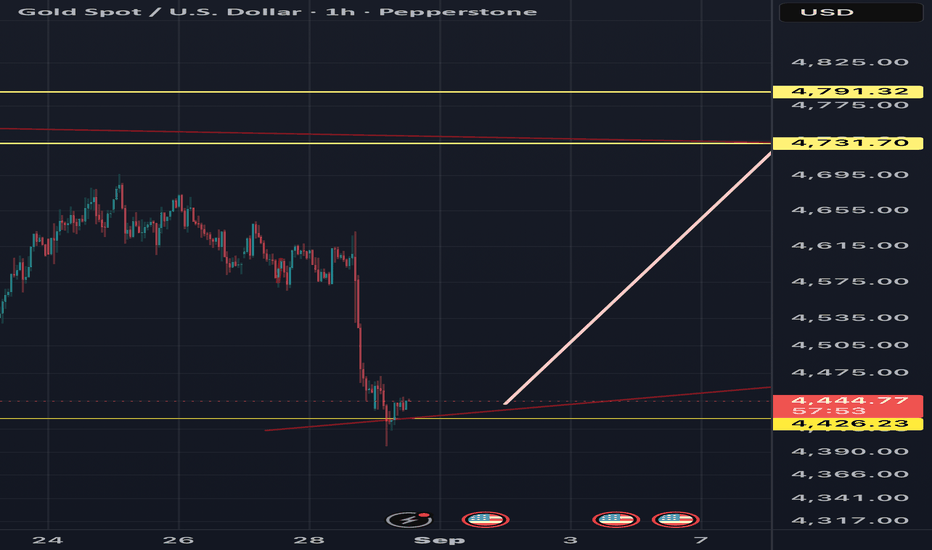
Elliott Wave Big PictureMy current Elliott Wave view is that the larger ABC correction from the previous major high has completed, and price may now be developing a new bullish sequence.
At this stage, it is still too early to know whether the advance from the July low will ultimately form a corrective ABC structure or develop into a larger 1-2-3-4-5 impulse. For now, I prefer to take the structure step by step and focus on the current A-B-C advance. As more price action develops, the larger-degree count can be reassessed.
The current interpretation has wave A completed, wave B completed, and wave C now developing.
For wave C, I am watching two main possibilities:
Impulsive wave C: If the internal structure develops as a clean 1-2-3-4-5 impulse, wave C could extend strongly. A common Fibonacci relationship would be around 1.618 × wave A, which on this chart corresponds to approximately 115.2.
Diagonal wave C: Wave C could instead develop as a diagonal. In that case, wave 4 may overlap wave 1, which is allowed within a diagonal. This would suggest a weaker, less impulsive structure and could make the A = C relationship around 99.6 an important Fibonacci reference.
These levels are reference zones rather than fixed targets. The main focus is on how the internal waves develop. The behavior of waves 3, 4 and 5 should provide more information about whether wave C is forming as a standard impulse or a diagonal.
There is also an alternative bearish scenario, where the structure from the July low could be developing as a triangle within wave A rather than the bullish interpretation shown here. I’m aware of that possibility, but I don’t want to overcomplicate the count at this stage. I’ll continue monitoring the internal structure and adjust the preferred scenario as price gives more confirmation.
Once wave C is complete, the next step will be to reassess the larger structure and determine whether this rise was simply an ABC correction or the beginning of a broader five-wave bullish sequence. Long 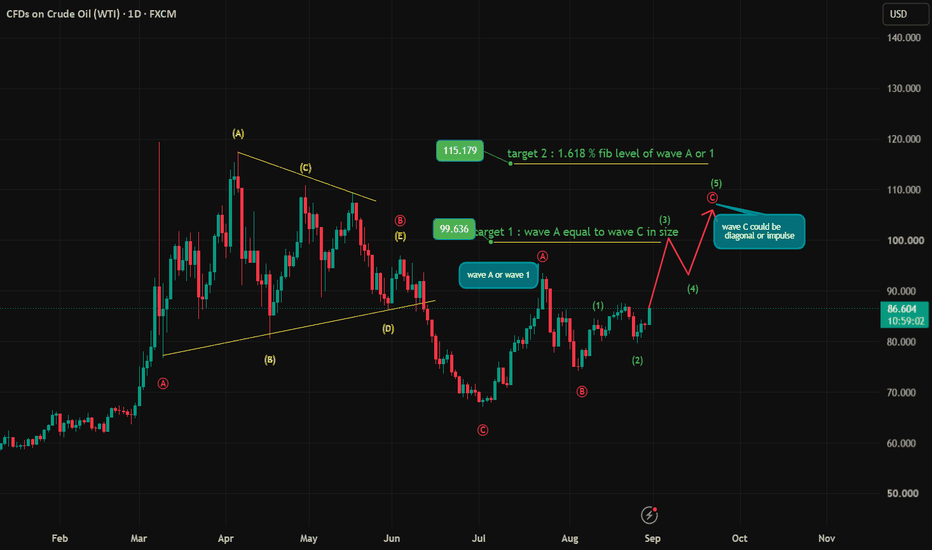
Long 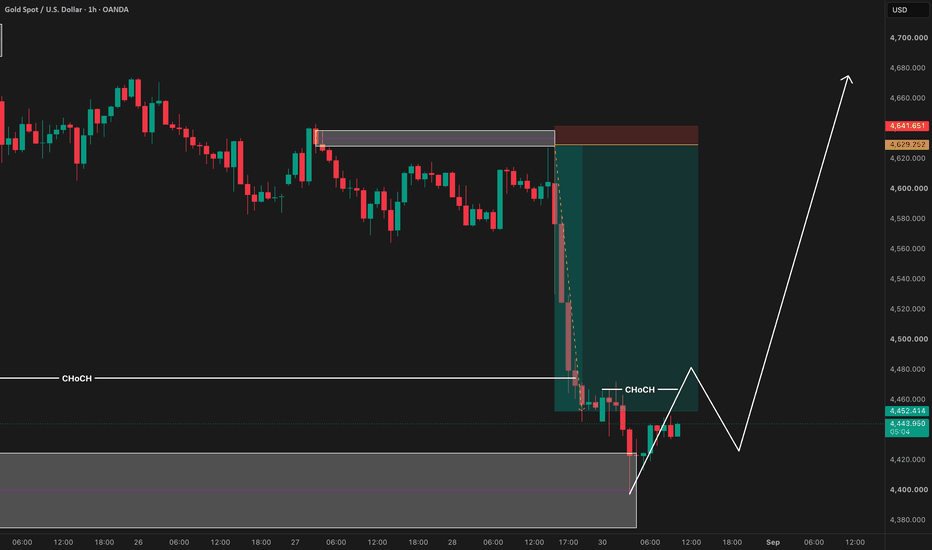
XAU/USD — WEEKLY HIGH SWEEP → BEARISH CONTINUATION
Gold is showing a potential high-probability bearish setup on the 4H chart.
Price formed a weekly high near 4,680, followed by a liquidity sweep/CHoCH and strong bearish displacement. The current retracement is approaching the marked 2H FVG + Fibonacci premium zone, creating a potential shorting area.
🔴 HIGH-PROBABILITY POI
Entry Zone: 4,514 – 4,542
FVG 2H: ~4,514
0.618 Fib: ~4,542
🎯 DOWNSIDE TARGETS
TP1: 4,400
TP2: 4,320
TP3: 4,280 — SSL / major liquidity zone
🛑 INVALIDATION
A strong 4H close above 4,555–4,600 would weaken the bearish setup and could signal bullish continuation.
🧠 SMC LOGIC
Weekly High → Liquidity Sweep → CHoCH → Bearish Displacement → FVG Retracement → SSL
The ideal scenario is for price to retrace into the 4,514–4,542 POI, show bearish rejection, and then continue lower toward sell-side liquidity.
⚠️ Don't blindly short the zone. Wait for confirmation on the lower timeframe.
Bias: 🔻 Bearish
POI: 4,514–4,542
Main Target: 4,280
Risk Management: Essential
#XAUUSD #Gold #GoldTrading #SMC #SmartMoneyConcepts #Liquidity #FVG #CHoCH #PriceAction #Forex #TradingView #TechnicalAnalysis #ForexTrading Short 
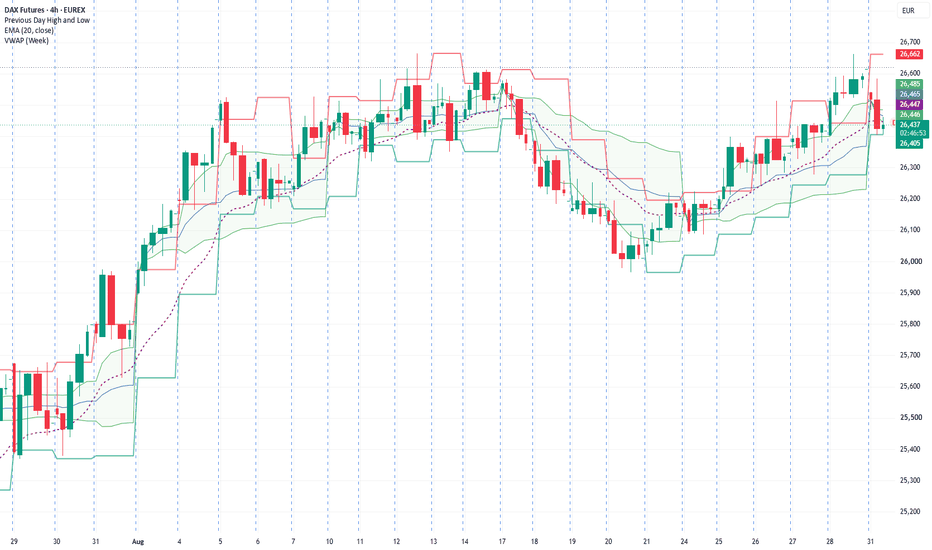
DAX — week of August 31 – September 4, 2026: LongLAST WEEK: "Long from 26,080–26,030, out into the trapped inventory from 26,498 up." The market turned at 26,087 — seven points above the bid — and ran to a record 26,615 settle with the order still resting. Never filled, so nothing to claim. The direction was right; the position never existed.
Long — Twice in three weeks the same seller has capped this tape at the same address — the last two weekly highs sit three points apart under 26,665 — and both times the index answered by settling higher, the second at a record. That is defense spending, not strength. My ground is the weekly pivot at 26,455, exactly where Monday is probing; hold it and the week earns the third run at the shelf. One daily settle under 26,247 and the coil was a decoy — that close retires the trade.
THE BIG PICTURE (weekly)
Friday's settle at 26,615 is the highest this market has ever printed — and it sits fifty points under a high that has refused to move for three weeks. Intraweek highs are where one seller works an offer; weekly settles are where money that stays overnight votes. The votes keep rising, the offer stands still. Tuesday brings the verdict: euro-area inflation is forecast back above three percent, and an index settling at records into that number is not running on rate hope — there is none left to take away. Whatever survives a hot print owns the shelf.
THE SWING (daily)
Last week bottomed in Monday's opening session and never went back — five higher closes into the record settle. This Monday reopened seventy-four points lower, the dip stopped at 26,405, and price walked straight back to the weekly pivot. The floors read 25,965, then 26,087, now this: each higher, each defended faster. The seller keeps one address; buyers keep raising theirs.
THE WEEK'S MAP (4H)
Upside: 26,476 (week-VWAP — first gate) → 26,541 (Monday's open — the reclaim) → 26,615 (the record settle) → 26,662 / 26,665 (the shelf — two weekly highs three points apart) → 26,822 (weekly R1 — first target beyond) → 27,030 (weekly R2 — the budget's outer edge).
Downside: 26,455 (weekly pivot — my ground) → 26,405 (Monday's low) → 26,247 (weekly S1 — the invalidation) → 26,087 (last week's low) → 25,965 (the August floor) → 25,880 (weekly S2 — where a broken coil drains).
One number all week: 26,665 — the record, retested to within three points last week and still standing. One seller, one address, three weeks — while every floor beneath him rose and the settles printed records. His inventory shows; his profit doesn't. The third arrival travels with two months of stops stacked behind the shelf toward 26,822, half the week's budget away. A settle under 26,247 means the staircase was scaffolding — the idea dies on that close.
THE CATALYSTS (CET)
Mon 31 — German flash CPI, national print 14:00 CET; Germany speaks before the euro-area does.
Tue 1 — THE day: euro-area flash CPI 11:00 CET, consensus back above three percent; US ISM 16:00.
Wed 2 — Nothing Tier-1 in Europe; the shelf trades on positioning, not headlines.
Thu 3 — Light: only US claims and the services ISM in the afternoon.
Fri 4 — US payrolls 14:30 CET, one month after a negative print; the week settles on that answer.
BOTTOM LINE
A shelf defended twice to the tick, floors rising underneath, record settles in between — I side with the settles. From the pivot at 26,455 the trade is the third test of 26,665 and the stops behind it. A daily close under 26,247 and the market has outvoted me; settlement is the only opinion I pay.
Not advice — trade your own plan.  Long
Long