XAUUSD — Bearish Repricing Below Premium POI
Market Context
Gold is trading around $4,455 after a sharp bearish displacement from the $4,631 Premium POI. The move broke through nearby support and pushed price directly into the marked Internal Demand, confirming strong short-term seller control.
The macro backdrop also turned more restrictive for Gold after Fed Chair Kevin Warsh’s Jackson Hole remarks increased expectations of a possible rate hike if inflation remains persistent. The US dollar strengthened sharply and short-term Treasury yields moved higher, contributing to Gold’s more than 3% decline.
SMC View
The impulsive decline from $4,631 confirms H1 bearish repricing. Price is now reacting from Internal Demand, so selling directly near the current low would mean chasing an already extended move.
The $4,540–$4,565 0.5–0.618 Bearish POI is the main decision zone. A corrective recovery into this area could rebalance the displacement before sellers attempt another expansion toward deeper sell-side liquidity.
Main Trading Scenario
Condition:
Gold retraces into the $4,540–$4,565 Bearish POI and forms a clear bearish rejection. A lower-timeframe bearish MSS or CHOCH is required before entry.
Entry: $4,540–$4,565 after bearish confirmation
SL: Above $4,575 and the rejection high
TP1: $4,445–$4,460
TP2: $4,365–$4,385
TP3: $4,324.637
Key Zones to Watch
Current price: $4,454.990
Main sell zone: $4,540–$4,565
Premium POI: $4,631.158
Internal Demand: $4,445–$4,460
Main target: $4,365–$4,385
Invalidation: Acceptance above $4,575
Confirmation: Bearish rejection with MSS or CHOCH
Prime Gold View
The sell bias remains valid while Gold stays below the 0.5–0.618 mitigation zone and maintains bearish H1 repricing. The preferred plan is to wait for a corrective recovery rather than chase price inside Internal Demand.
If sellers defend $4,540–$4,565, deeper sell-side liquidity around $4,375 could become the next draw. Acceptance above the bearish POI would weaken the immediate setup.
No confirmation, no trade.  Short
Short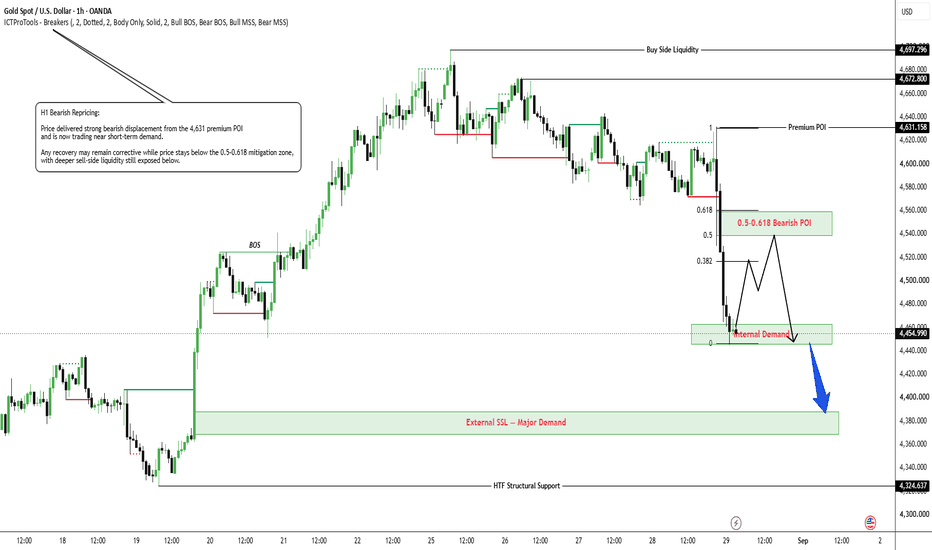
Long 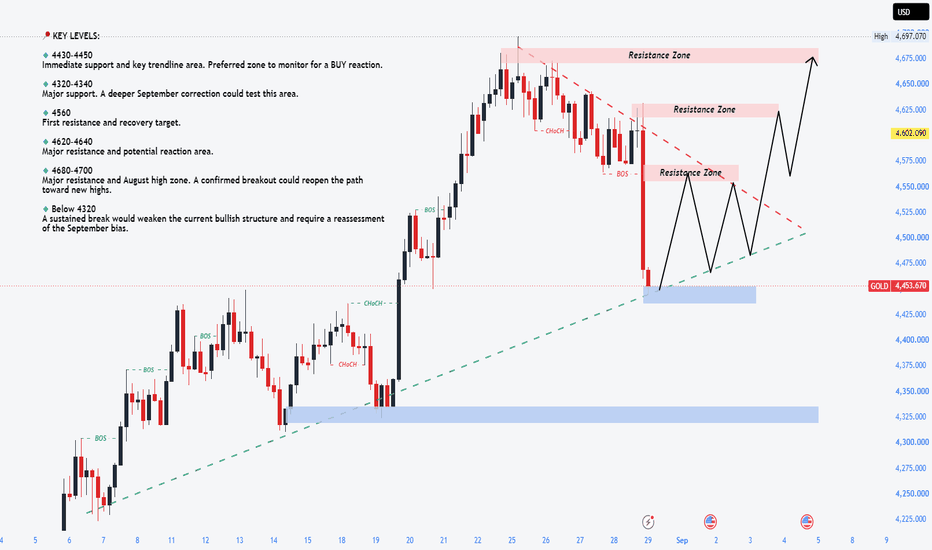
Best Candlestick Pattern For Trend Trading Gold XAUUSD
This secret pattern will change the way you trade Gold XAUUSD.
If you study technical analysis in Gold trading, there is one unique candlestick pattern that you absolutely need to know.
In this article, you will learn the structure and the meaning of one of the most accurate candlesticks in Gold trading.
I will teach you how to recognize this pattern and how to trade it for maximum profits.
Let's start with some theory and let me show you how this candlestick pattern looks.
This candlestick pattern is called inside bar.
It is based on a combination of at least 3 candles.
The first candlestick in a sequence should be a strong bullish or bearish candle. The consequent candles should strictly close within its range.
If at least 2 candles close within the range of the first candle with its bodies, that will be a valid inside bar.
The first candle will always be called the mother's bar, while the following candles will be called the inside bars.
That's a perfect example of the inside bar pattern on Gold XAUUSD chart on a daily.
This pattern is based on 2 important elements that you should always pay close attention to.
The upper boundary of the range of the mother's bar will compose a significant resistance that will provide a safe place to sell.
While the lower boundary of the range of the mother's bar will be a strong support to buy Gold from.
Look how nicely Gold price respected the resistance of the range, dropped to its support and started to grow then.
Once you identified the inside bar, you can easily trade it within the range.
However, I strictly recommend waiting for a confirmation signal before you place a trade.
One of the proven confirmations is a price action signal on lower time frames.
In the example above, Gold formed a bullish chart pattern - double bottom after a test of a support and a bearish pattern - head and shoulders after a test of a resistance.
Remember that the market can not stay within the range of the inside bar candlestick pattern forever.
Bullish violation and a candle close above the range will be a strong signal to buy Gold.
While, a bearish breakout of its range will provide a strong bearish confirmation.
That's how a breakout of the underlined resistance triggered a strong rally on Gold.
Inside bar is the essential pattern both for the gold swing traders and day traders.
This pattern provides a lot of profitable trading opportunities, being very simple to recognize.
❤️Please, support my work with like, thank you!❤️
I am part of Trade Nation's Influencer program and receive a monthly fee for using their TradingView charts in my analysis.
Education 
XAU/USD | First Short, Then LONG! (READ THE CAPTION)By analyzing the #Gold chart on the 6H timeframe, we can see that after the previous analysis, Gold continued to move lower exactly as expected and dropped toward the $4569 region, bringing the total movement from this setup to more than 1200 pips.
Currently, Gold is trading around $4593. The broader structure still remains bullish, but in the short term we are clearly inside a corrective phase and, in my view, this correction may still have more room to continue.
The nearest supply zones to monitor are around $4610 – $4630, followed by the stronger $4660 – $4690 area. On the downside, the first important levels are around $4560 – $4570, followed by $4523, $4500, and finally the major $4482 – $4523 demand zone.
This $4482 – $4523 area is especially important. If Gold reaches this zone and buyers step in strongly, I believe it could become the starting point for the next major bullish wave. In that case, the upside targets I would monitor are $4600, followed by $4650, then $4700. If the broader bullish trend resumes with strong momentum, $4800, $4900, and even the psychological $5000 level could become realistic medium-term targets.
So for now, the main picture is simple: the broader trend is still bullish, but the short-term correction may not be finished yet. The reaction from the $4482 – $4523 demand zone could become extremely important for the next major move.
Please support me with your likes and comments to motivate me to share more analysis with you and share your opinion about the possible trend of this chart with me !
Best Regards , Arman Shaban Long 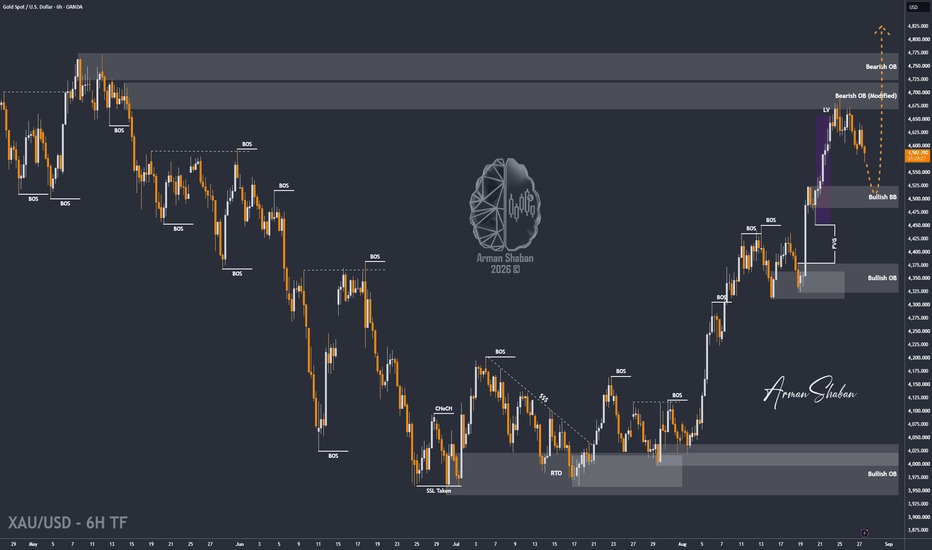
Long 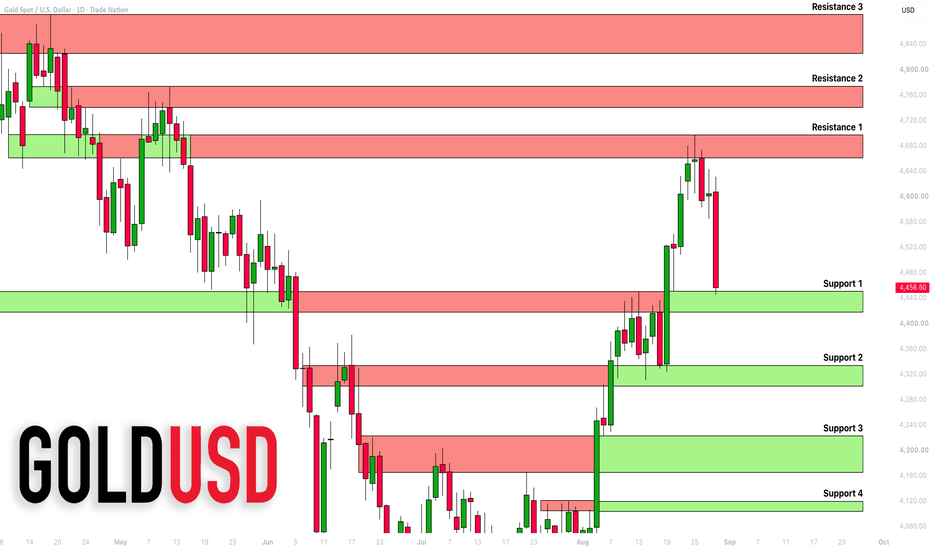
XAUUSD — Dynamic Supply Sell Continuation
Market Context
Gold is trading around $4,585 after extending lower inside the descending bearish delivery range. Price continues to print lower highs beneath dynamic supply, while the current reaction from Internal Demand has not yet changed the broader short-term bearish structure.
Macro pressure remains elevated ahead of Fed Chair Kevin Warsh’s Jackson Hole speech later today. Gold has softened as markets prepare for a potentially hawkish message after July core PCE remained at 3.7%, while several Fed officials have recently emphasized persistent inflation risks. Oil is also easing despite ongoing Iran-related tensions, reducing some immediate safe-haven support.
SMC View
Order flow remains bearish inside the descending channel, with repeated failures beneath dynamic supply confirming that sellers still control the immediate delivery.
Price is currently reacting from the $4,560–$4,575 Internal Demand area, so chasing a sell directly into support offers weaker positioning. The cleaner setup is a corrective retracement toward $4,595–$4,610, followed by renewed bearish rejection.
Main Trading Scenario
Condition:
Gold retraces into the $4,595–$4,610 dynamic supply area and forms a clear bearish rejection. A lower-timeframe bearish MSS or CHOCH is required before entry.
Entry: $4,595–$4,610 after bearish confirmation
SL: Above $4,620 and the rejection structure
TP1: $4,560–$4,575
TP2: $4,520–$4,540
TP3: $4,460–$4,475
Key Zones to Watch
Current price: $4,585.390
Main sell zone: $4,595–$4,610
Internal Demand: $4,560–$4,575
External SSL: $4,520–$4,540
Main target: $4,460–$4,475
Invalidation: Acceptance above $4,620
Confirmation: Bearish rejection with MSS or CHOCH
Prime Gold View
The sell bias remains valid while Gold stays inside the bearish delivery range and below dynamic supply. The preferred plan is to wait for a corrective retracement rather than chase price directly into Internal Demand.
If sellers regain control around $4,595–$4,610, price could rotate toward External SSL and potentially the Major SSL Objective near $4,470. Acceptance above $4,620 would weaken the immediate bearish setup.
No confirmation, no trade. Short 
Small OB Retest Before Another Drop
Fundamental Analysis
Gold remains cautious ahead of Fed Chair Kevin Warsh’s Jackson Hole speech. Persistent U.S. inflation keeps rate expectations uncertain and may continue to create short-term pressure on Gold.
Technical Analysis
On H1, Gold remains in a bearish structure after the recent CHoCH, MSS and BOS.
Price is now near 4,600, with the 4,606–4,618 Small OB acting as the first resistance. A stronger rebound could reach the upper 4,635–4,644 OB.
Volume Profile also shows heavy activity around 4,600, making this area an important decision point.
Important Key Levels
4,665–4,675 — Major Resistance
4,635–4,644 — Upper Small OB
4,606–4,618 — Small OB / Resistance
4,560–4,570 — Liquidity
Trading Scenario
Sell priority remains on a rebound into 4,606–4,618 followed by bearish rejection.
Target: 4,560–4,570 liquidity.
Invalidation: H1 acceptance above 4,644.
Overall View
The H1 structure remains bearish. A short rebound may develop first, but the main focus stays on another wave lower toward liquidity.
Will Gold retest the Small OB before moving lower? Short 
Bearish Repricing Meets Structural SupportXAUUSD | 4H Demand Test After 4697 Liquidity Sweep — Bearish Repricing Meets Structural Support
Market Overview
XAUUSD is currently trading around:
4455
following an aggressive decline from the recent:
4697
swing high.
The market has now retraced approximately:
242 points / ~5.2%
from the recent high and is testing the upper boundary of the first major 4H demand area:
4416 – 4441
This materially changes the execution framework.
The market is no longer simply moving toward support.
Price is now actively testing the first major structural demand zone.
At the same time, the macro backdrop remains decisively bearish in the short term.
Federal Reserve Chair Kevin Warsh's Jackson Hole remarks triggered a significant hawkish repricing across rates markets.
Following the speech:
September Fed rate-hike probability increased from approximately 36% to around 58%.
The U.S. Dollar strengthened to a more than one-week high.
U.S. 2-year Treasury yields moved sharply higher.
Gold fell more than 3% during Friday's session.
The current selloff therefore has both:
Macro confirmation + Technical confirmation.
However, because price is now directly approaching major demand, the quality of chasing additional shorts has deteriorated significantly.
Current Market Classification
Short-Term Macro Bias: Bearish
4H Momentum: Bearish
Current Location: Major Demand
Execution Bias: Neutral until confirmation
Medium-Term Structure: Bullish while major demand remains intact
Current Regime: Policy Repricing + Long Liquidation
Macro Catalyst Layer
1. Federal Reserve Policy Repricing
The dominant catalyst behind the decline is a shift toward tighter expected Fed policy.
Warsh emphasized that inflation remains persistent and indicated that the Federal Reserve may need to take additional action if inflation fails to move convincingly toward the 2% objective.
Markets reacted immediately by increasing the probability of another rate hike.
This matters for Gold because:
Higher expected policy rates increase the opportunity cost of holding a non-yielding asset.
The immediate transmission has been:
Hawkish Fed → Higher Short-Term Yields → Stronger USD → Lower Gold
2. USD Channel
The U.S. Dollar strengthened following Warsh's speech.
This confirms that part of the Gold decline is being driven through the traditional inverse Dollar relationship.
A stronger USD creates two direct pressures:
Gold becomes more expensive for non-USD buyers.
Global capital receives a stronger incentive to hold Dollar-denominated cash and fixed-income assets.
Therefore:
USD Channel = Bearish for Gold.
3. Rates / Real-Yield Channel
The most important confirmation came from the U.S. 2-year Treasury yield.
The 2Y yield rose sharply as traders repriced the Fed path.
The front-end reaction is important because it tells us the move is primarily related to:
Expected monetary-policy tightening.
rather than a traditional risk event.
For Gold:
Higher front-end yields = higher opportunity cost = bearish pressure.
This remains one of the most important cross-asset variables to monitor.
4. Risk Sentiment Channel
The current decline is not a classic risk-off move.
Global equities remained relatively resilient even while Gold fell sharply.
That means investors were not selling Gold because safe-haven demand disappeared across markets.
Instead, the dominant force was:
Rates repricing and Dollar strength.
This distinction is important.
Gold can still benefit from geopolitical uncertainty and fiscal stress even while temporarily declining because of monetary-policy repricing.
5. Treasury / Liquidity Channel
The medium-term macro environment remains structurally supportive for Gold.
Recent U.S. Treasury intervention through expanded buyback operations was designed to support longer-duration Treasury securities and contain pressure on borrowing costs.
These measures previously contributed to:
Lower long-end yields.
A weaker Dollar.
A major upside move in Gold.
The Treasury intervention creates an important medium-term tension.
If authorities repeatedly attempt to suppress long-term borrowing costs, adjustment pressure can migrate toward:
The U.S. Dollar.
That creates the possibility of a broader:
Dollar Debasement Trade
which remains structurally supportive for Gold.
Institutional Macro Positioning
Citigroup has recently shifted its positioning toward:
More favorable exposure to Gold.
Reduced bearish Treasury exposure.
A continued short USD stance.
Citi has also highlighted the possibility that aggressive efforts to contain long-term Treasury yields could eventually weigh on the Dollar.
This means the broader institutional macro narrative has not turned structurally bearish on Gold.
Instead, the market currently contains a conflict between:
Short-Term Monetary Tightening
and:
Medium-Term Fiscal / Currency Debasement Risk
Macro Conflict
Short-Term
Hawkish Fed
→ Higher 2Y Yields
→ Stronger USD
→ Gold Lower
Medium-Term
Treasury Intervention
+ Fiscal Stress
+ Potential Yield Suppression
→ Dollar Debasement Risk
→ Gold Supported
Structural vs Temporary Drivers
Short-Term Drivers
Warsh's hawkish repricing
Rate-hike expectations
Higher front-end yields
USD strength
Long liquidation
These are currently dominant.
Structural Drivers
Persistent U.S. fiscal pressure
Treasury intervention
Long-duration bond instability
Potential Dollar debasement
Strategic institutional Gold demand
These remain supportive over the medium term.
4H Technical Structure
The broader chart shows a major bullish expansion from:
3942 → 4697
This move completely displaced the previous bearish market structure.
Multiple descending trend structures were broken during the expansion.
The market then entered a major premium supply zone:
4676 – 4739
and printed a swing high at:
4697
Price failed to establish acceptance above this region.
Instead, the market produced:
Buy-side liquidity sweep.
Rejection from premium.
Failure above supply.
Strong bearish displacement.
Break below shallow Fibonacci support.
This sequence strongly suggests:
Buy-Side Liquidity Sweep → Rejection → Long Liquidation
Importance of the 4697 High
The 4697 high represents more than simple resistance.
It marks:
A completed upside liquidity objective.
The termination of the latest bullish expansion.
Rejection from a major supply zone.
The origin of the current bearish displacement.
As long as price remains below:
4676 – 4739
the market has not invalidated the rejection.
Displacement Analysis
The decline from the 4600+ area toward 4455 occurred with very limited balance.
This is a clear:
Bearish Displacement
rather than a slow corrective grind.
That distinction suggests:
Long liquidation.
Stop-loss activation.
Fresh short participation.
Macro repricing.
However, displacement eventually becomes extended.
Price has now moved almost vertically toward structural demand.
This means the execution environment has changed.
Earlier in the decline:
Selling momentum was favorable.
At current location:
Selling directly into demand carries significantly worse risk/reward.
Fibonacci Structure
The major Fibonacci retracement is measured from:
3942.10 → 4697.10
Important levels:
0.236 = 4518.9
0.382 = 4408.7
0.500 = 4319.6
0.618 = 4230.5
0.707 = 4163.3
0.764 = 4120.3
0.786 = 4103.7
Price has already broken decisively below:
4519
This confirms that the correction is no longer shallow.
The next major Fibonacci decision point is:
4408.7
which aligns almost perfectly with the first major demand zone.
Primary Decision Zone
4409 – 4441
This is now the most important area on the chart.
Confluence includes:
4H demand at 4416–4441.
0.382 Fibonacci at 4408.7.
Previous breakout structure.
Potential sell-side liquidity below the zone.
Location after an extended bearish displacement.
This creates a high-value decision area.
The market must now prove whether it wants to:
Accept below demand
or:
Sweep liquidity and reverse.
Critical Distinction: Acceptance vs Liquidity Sweep
A temporary move below 4416 or 4409 is not automatically bearish continuation.
The key question is:
Can price remain below the level?
If price trades below 4409 but rapidly returns above 4441:
That would indicate liquidity extraction rather than true bearish acceptance.
If price breaks below 4409 and holds below the zone:
That would indicate genuine repricing toward deeper value.
Secondary Demand Zone
4292 – 4328
This is the next major demand region.
It is structurally stronger than the first zone because it aligns with:
0.500 Fibonacci at 4319.6.
A previous structural base.
The origin of a major bullish expansion.
A potential high-liquidity rebalancing area.
If 4409 fails decisively:
4292 – 4328 becomes the primary bearish objective.
Why 4292 – 4328 Matters
This zone is also the key medium-term structural defense.
As long as price remains above this region:
The larger bullish structure remains intact.
A clear 4H breakdown and acceptance below 4292 would materially weaken the medium-term bullish thesis.
Deep Demand Zone
4004 – 4048
This zone is located close to the origin of the larger bullish expansion.
A move toward this region would indicate that a significant portion of the entire rally has been retraced.
It should therefore be considered:
Major Higher-Timeframe Demand
rather than the immediate base-case target.
Volume Profile Context
The visible-range Volume Profile shows multiple high-volume acceptance areas below current price.
This means the market is moving from a relatively low-balance displacement environment toward regions where historically more two-sided trade has occurred.
This matters because:
The deeper price enters established value, the less attractive momentum chasing becomes.
The likely transition becomes:
Displacement → Reaction → Balance → Next Expansion
rather than endless straight-line selling.
Current Liquidity Map
Buy-Side Liquidity Already Taken
The market has already completed a major upside liquidity event around:
4697
Therefore, the immediate liquidity focus has moved below price.
Immediate Sell-Side Liquidity
The next key pool sits beneath:
4409 – 4416
This liquidity is extremely important because the market can use it in two very different ways:
Continuation: consume liquidity and remain below.
Reversal: sweep liquidity and reclaim the zone.
Short-Term Bias
BEARISH
The short-term bearish bias remains valid because:
The 4697 high was rejected.
Price failed inside 4676–4739 supply.
The market generated strong bearish displacement.
4519 support was decisively broken.
USD strengthened.
2Y yields increased.
Fed hike expectations increased.
However:
Bearish bias does not mean bearish execution at every price.
At approximately 4455, price is too close to major demand to justify aggressive short chasing.
Current Execution Bias
NEUTRAL / WAIT FOR CONFIRMATION
This is the most important update.
Current price location creates asymmetric risk.
Selling directly into 4409–4441 risks entering just before:
A liquidity sweep and short squeeze.
Buying immediately risks entering before:
A confirmed demand failure.
Therefore:
The highest-quality setup is confirmation-driven, not prediction-driven.
Short-Term Bearish Invalidation
Initial momentum invalidation:
4519 reclaim
Stronger structural invalidation:
4580 – 4610 reclaim
Full bearish thesis invalidation:
Acceptance above 4676 – 4739
Medium-Term Bias
BULLISH STRUCTURE UNDER ACTIVE CORRECTION
The larger 3942 → 4697 expansion remains structurally bullish.
The current decline should therefore be classified as:
A bearish correction inside a larger bullish structure
until the market proves otherwise.
Medium-Term Bullish Invalidation
The important level is:
4292
A clean 4H breakdown and acceptance below:
4292 – 4328
would materially weaken the bullish swing structure.
If that occurs, downside probability increases toward:
4230
4163
4120 – 4104
Narrative Bias vs Structural Confirmation
Narrative Bias
Short-term macro conditions favor lower Gold.
Fed hawkishness
Higher yields
USD strength
Sticky inflation concerns
Structural Confirmation
Price action supports the narrative.
4697 rejection
Premium supply failure
4519 break
Bearish displacement
Therefore:
The bearish short-term narrative is structurally confirmed.
However, location now matters more than narrative.
Price is testing demand, so fresh bearish conviction requires:
Acceptance below support.
Scenario 1 — Bearish Continuation
This remains the primary directional scenario, but only after confirmation.
Required Conditions
Price enters the 4416–4441 demand zone.
Buyer response remains weak.
4409 Fibonacci support is broken.
Price fails to immediately reclaim 4416.
4H price establishes acceptance below 4409.
USD remains supported.
US 2Y Yield remains elevated.
Primary Bearish Trigger
4H acceptance below 4409.
A single wick below the level is not sufficient.
The setup improves materially if price breaks 4409 and then:
Retests 4409–4441 from below and rejects.
Ideal Bearish Execution Sequence
Break 4409 → Acceptance Below → Retest → Rejection → Short
This is significantly higher quality than:
Selling directly at 4455.
Bearish Targets
Target 1: 4328 – 4292
Target 2: 4230
Target 3: 4163
Target 4: 4120 – 4104
Bearish Continuation Confirmation
The cleanest structural confirmation would be:
4H close below 4409.
Failure to reclaim 4441.
Lower high formed below broken demand.
This would transform the first demand zone into:
New resistance / supply.
Bearish Continuation Invalidation
The continuation thesis becomes weaker if price:
Sweeps below 4409 and immediately reclaims 4441.
It becomes significantly weaker after:
4519 reclaim.
Scenario 2 — Bullish Liquidity Sweep & Reversal
This is the key alternative scenario.
The bullish setup does not require price to hold perfectly above 4416.
In fact, a move below demand could create the better setup.
The ideal reversal sequence is:
Price trades through 4416.
4409 liquidity is swept.
Stops below demand are triggered.
Price rapidly reclaims 4416–4441.
Bullish displacement appears.
A higher low forms.
4519 is reclaimed.
Initial Bullish Trigger
Sweep below 4409 + reclaim above 4441
This would indicate:
Failed breakdown + sell-side liquidity extraction.
Bullish Confirmation Level
4519
A reclaim of 4519 would be important because it would recover the broken 0.236 Fibonacci level and indicate that sellers are losing structural control.
Stronger Bullish Confirmation
Acceptance above:
4580 – 4610
would suggest that the bearish displacement is being structurally reversed rather than merely retraced.
Bullish Targets
Target 1: 4519
Target 2: 4580 – 4610
Target 3: 4676
Target 4: 4697
Target 5: 4739
Bullish Invalidation
The bullish reversal thesis fails if price establishes sustained acceptance below:
4409
and becomes significantly weaker if:
4292 – 4328
also fails.
Scenario 3 — Deeper Correction Into 4292 – 4328
There is also a third structural possibility.
The first demand may fail without causing a complete higher-timeframe breakdown.
In this case:
4409 fails → Price rotates toward 4292 – 4328
This would still be consistent with a deeper retracement inside the broader bullish swing structure.
Why This Scenario Matters
The 4292–4328 region has stronger structural confluence than the first demand.
It contains:
0.50 Fibonacci.
Previous breakout base.
Major 4H demand.
Potential deeper sell-side liquidity.
Therefore:
A bullish setup from 4292–4328 could offer a stronger swing opportunity than the first demand zone.
Ideal Deeper Bullish Setup
Sweep 4292 → Reclaim 4328 → Bullish Displacement → Higher Low
This would create a high-quality structural reversal pattern while preserving the larger bullish market structure.
Cross-Asset Confirmation Framework
Price action should not be traded in isolation.
The following markets are critical.
DXY
For bearish Gold continuation:
DXY should remain firm or extend higher.
For bullish Gold reversal:
DXY should fail to extend or begin a meaningful reversal lower.
US 2-Year Treasury Yield
This is currently one of the most important Gold inputs.
For bearish continuation:
2Y yields should remain elevated or rise further.
For bullish reversal:
2Y yields should begin unwinding the Warsh-driven repricing.
Equity Market
Equities are less useful than USD and 2Y yields in the current regime.
The Gold selloff occurred while equities remained relatively firm.
Therefore:
Rates currently matter more than risk sentiment.
Positioning & Flow Context
Recent global fund-flow data shows that commodity funds, led by Gold and precious metals, attracted approximately:
$4.21 billion
during the latest reported week, the strongest inflow in around six months.
This indicates that medium-term institutional demand has not disappeared despite the current decline.
At the same time, the violent drop following Warsh suggests:
Leveraged long positioning was vulnerable to liquidation.
Therefore, the current price action is best understood as:
Short-Term Positioning Unwind Inside a Still-Supported Structural Gold Allocation Theme
Upcoming Macro Catalyst — U.S. Employment Report
The next major macro event is the U.S. August employment report.
Current expectations point to approximately:
+45K Nonfarm Payroll growth
following weakness in the previous month.
This report can materially affect:
September Fed hike expectations.
US 2Y yields.
DXY.
XAUUSD.
Stronger-Than-Expected Employment
Expected transmission:
Strong Jobs
→ Rate-Hike Probability Higher
→ 2Y Yield Higher
→ USD Higher
→ Gold Lower
This would increase the probability of:
4409 failure → 4328 – 4292
Weaker-Than-Expected Employment
Expected transmission:
Weak Jobs
→ Hawkish Pricing Unwind
→ 2Y Yield Lower
→ USD Lower
→ Gold Short Squeeze
This would become especially powerful if weak data arrives while Gold is:
Sweeping 4409 – 4416 liquidity.
Macro Asymmetry
A meaningful portion of the hawkish repricing has already occurred.
Gold has already declined approximately 5% from the recent high.
This creates an important asymmetry:
Strong data can extend the decline, but weak data may trigger a disproportionately aggressive reversal because bearish positioning has already expanded.
Key Levels Summary
4697: Recent swing high / completed buy-side liquidity
4676 – 4739: Major supply / full bearish invalidation
4580 – 4610: Strong bullish recovery confirmation
4519: First major reclaim / 0.236 Fib
4416 – 4441: Primary 4H demand
4409: 0.382 Fib / key continuation trigger
4292 – 4328: Major swing demand
4319: 0.50 Fib
4230: 0.618 Fib
4163: 0.707 Fib
4104 – 4120: Deep retracement region
4004 – 4048: Major higher-timeframe demand
Execution Framework
At current price around:
4455
three trades should be avoided:
Blind short directly into demand.
Blind long simply because support has been reached.
Entering before knowing whether 4409 is accepted or rejected.
The preferred execution is event-driven.
Bearish Setup
4409 Break → Acceptance → Retest Failure → Short
Targets:
4328–4292 → 4230 → 4163
Bullish Setup
4409 Sweep → 4441 Reclaim → Bullish Displacement → 4519 Reclaim → Long
Targets:
4580–4610 → 4676 → 4697
Strategic Decision
The current market should be classified as:
Bearish Short-Term Repricing Inside a Broader Bullish Structure
The bearish move is fundamentally justified.
The bearish structure is confirmed.
However:
Price location no longer favors aggressive short chasing.
The market has reached its first meaningful decision point.
Primary Driver
Hawkish Fed Policy Repricing
Secondary Driver
USD Strength + Higher US 2Y Treasury Yields
Structural Bullish Driver
Fiscal Pressure + Treasury Intervention + Dollar Debasement Risk
Current Market Regime
Policy Shock + Long Liquidation
Current Tactical Stance
Wait for confirmation at 4409 – 4441.
Primary Bearish Scenario
4H acceptance below 4409 → 4328 – 4292
Primary Bullish Scenario
4409 liquidity sweep + 4441 reclaim → 4519
Bullish Structural Confirmation
4519 reclaim
Medium-Term Bullish Failure
4H acceptance below 4292
Full Bearish Invalidation
Acceptance above 4676 – 4739
Final View
XAUUSD has transitioned from a momentum market into a decision market.
The move from 4697 to approximately 4455 represents a powerful macro-driven bearish displacement, supported by higher Fed tightening expectations, rising U.S. front-end yields and a stronger Dollar.
However, price is now directly testing the first major 4H demand cluster around:
4409 – 4441
This means the next directional opportunity will likely be determined by the market's behavior inside this area.
The critical distinction is:
Acceptance vs Rejection.
If sellers achieve sustained acceptance below:
4409
the correction should extend toward:
4328 – 4292
with deeper downside available toward 4230 if that structure also fails.
If sellers instead sweep liquidity below 4409 and price rapidly reclaims:
4441
the market would produce the first evidence of a:
Failed Breakdown + Bullish Reversal
A subsequent reclaim of:
4519
would materially strengthen that reversal thesis.
Therefore, the highest-quality tactical approach is:
Do not chase the existing move. Let the market reveal whether 4409–4441 becomes accepted value or a liquidity-sweep reversal zone. XAU/USD Recovery Setup With Strong Upside Potential📊Gold is showing a strong recovery on the 4-hour chart after the recent correction. Buyers are gradually regaining control, while the overall structure continues to favor further upside. 🔥
The 4,444 level is crucial for the next move. If price breaks below 4,444, it could retest 4,387 before buyers step back in and drive the market upward again. 📊 If the retest holds and bullish momentum returns, price could move toward the first target at 4,507, followed by 4,542 and ultimately 4,614. 🚀
The reaction around 4,387 will be important for confirming the next bullish move. A strong recovery from this level could strengthen the upside setup and support continuation toward the projected targets. 💎📈
If you found this analysis helpful, don’t forget to LIKE 👍 and COMMENT 💬! Long 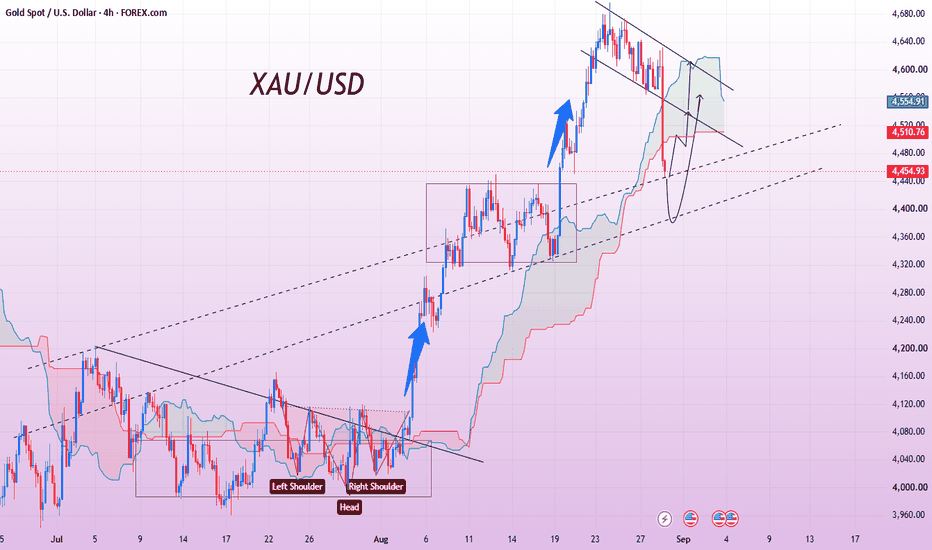
XAUUSD: How to trade next week?This month, driven by various bullish news and data, gold surged sharply, peaking near 4700, the high point of this rally. However, I have repeatedly warned that once all bullish catalysts are priced in, gold will lose solid support and a large‑scale downward correction is inevitable. The market has once again proven my view, and our orders have generated substantial profits.
After the sharp downward correction on Friday, gold is unlikely to keep falling next week. It is expected to range‑bound between 4420‑4520 in the short term. A new trend will emerge once the market breaks out either downward or upward. We only need to trade along with this new market trend.
If gold breaks down below 4420 next week, we can go short following the market, targeting around 4400. If gold breaks above 4520, it signals the end of the bearish correction and the start of a fresh uptrend; price will retest the resistance zone near 4700, and we should go long accordingly.
Therefore, do not over‑guess the market. Simply wait for a confirmed trend and trade in its direction. I will keep delivering accurate signals to help you seize new trading opportunities. Short 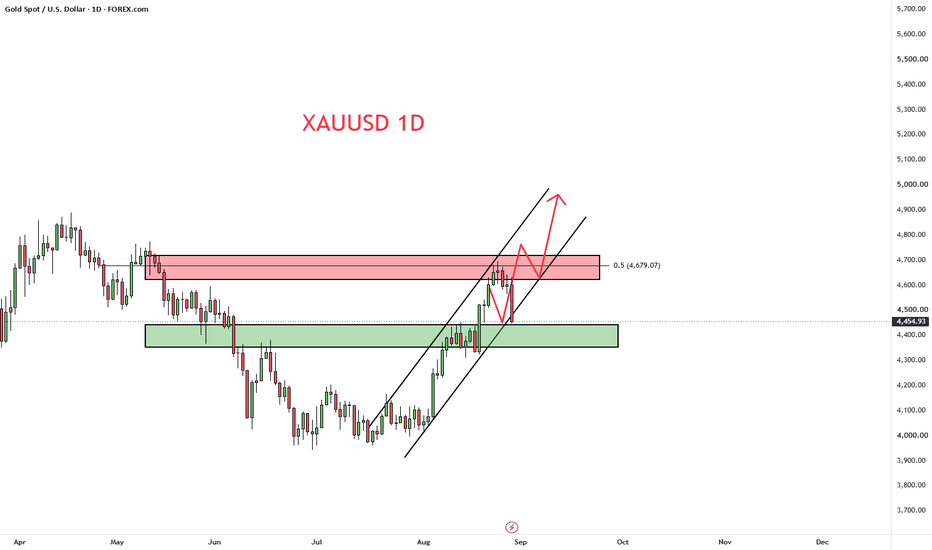
Long 
Gold | Bearish continuation & downside potentialGold | Bearish continuation & downside potential
Fundamental
Gold is showing signs of exhaustion after its strong historical rally. A firmer U.S. dollar and profit-taking near the highs are creating renewed downside pressure. Market attention is now heavily focused on Federal Reserve Chair Kevin Warsh’s Jackson Hole speech, where investors are looking for clearer signals on inflation, interest rates and the Fed’s future policy reaction.
A more hawkish policy message, particularly if Warsh emphasizes the need to respond to persistent inflation with higher rates, could strengthen the dollar and weigh on gold.
Technical
Gold is currently trading below the rising trendline, suggesting that the previous bullish structure is losing momentum. Rejection from the 4,632–4,655 resistance zone could strengthen the bearish case.
A sustained break below 4,545 would expose the next downside levels around 4,480 and potentially 4,420.
SMC View
From an SMC perspective, the recent rally appears vulnerable to a liquidity distribution phase after taking liquidity around the previous highs. Failure to reclaim the 4,632–4,655 supply zone could indicate bearish displacement and a shift toward lower liquidity pools.
A clean break below 4,545 would strengthen the bearish structure and increase the probability of a deeper retracement.
Trading Scenario
Bearish scenario: Rejection from 4,632–4,655 followed by bearish displacement could open the path toward 4,545 and 4,480.
If 4,545 breaks with strong selling pressure, the next areas to monitor are 4,420 and potentially 4,200.
Bullish alternative: A strong reclaim and sustained close above 4,655 could invalidate the immediate bearish setup and reopen the upside toward the previous highs.
Key Levels to Watch
Resistance: 4,632 | 4,655
Support: 4,545 | 4,480
Downside levels: 4,420 | 4,200
Bearish invalidation: 4,684
Invalidation
A sustained break and acceptance above 4,684 would invalidate the bearish continuation thesis and suggest that buyers have regained control.
Professional Insights
The key here is confirmation rather than chasing the downside. Price is approaching a major decision area, while the Jackson Hole event could increase volatility. I would watch how gold reacts around 4,632–4,655 and whether sellers can produce a decisive break below 4,545.
Risk Management
Avoid entering during high-volatility news spikes. Wait for confirmation around the key levels, use controlled position sizing, and define the invalidation level before taking any position.
Disclaimer
This analysis is shared for educational purposes only and does not constitute financial advice. Short 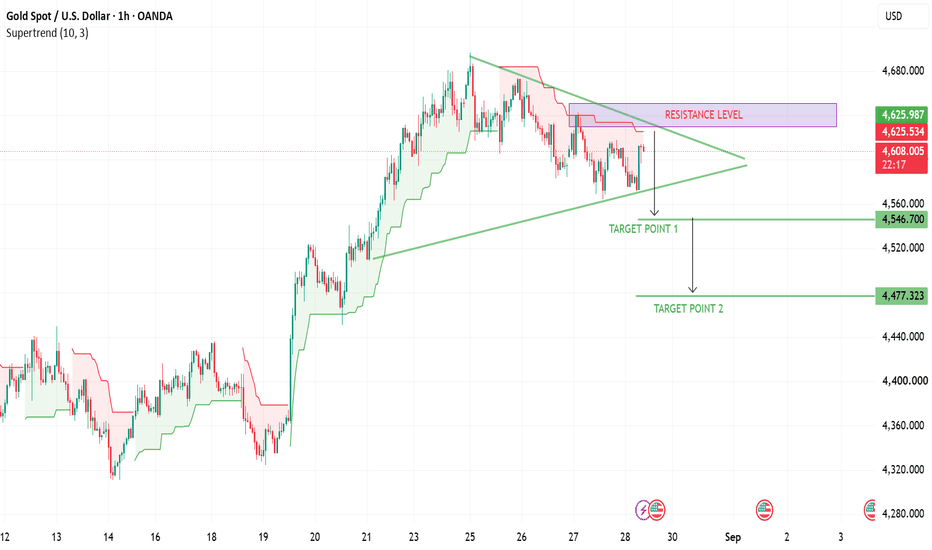
XAUUSD | Rising Structure Breakdown & Liquidity Test🔹 XAUUSD has been trading within a rising price structure, forming higher highs and higher lows before facing strong rejection near the 4,650–4,700 resistance zone. Price has now broken below the lower boundary of the ascending structure, suggesting a potential shift in short-term market structure. The recent bearish move has brought price toward the 4,450 area, while a notable liquidity zone remains near 4,330–4,350. This area could become important if selling pressure continues.
🔸 From a price-action perspective, the bearish structure may remain relevant while price stays below the broken trendline and resistance area. A continued decline could allow price to test the highlighted liquidity zone, while a strong recovery back above the broken structure could weaken the bearish scenario and bring resistance back into focus. Traders may wait for clear price confirmation before considering any trade. If the liquidity area fails to hold, further downside could develop.
This analysis is for educational purposes only and does not constitute financial or investment advice. Always conduct your own research before making trading decisions. Short 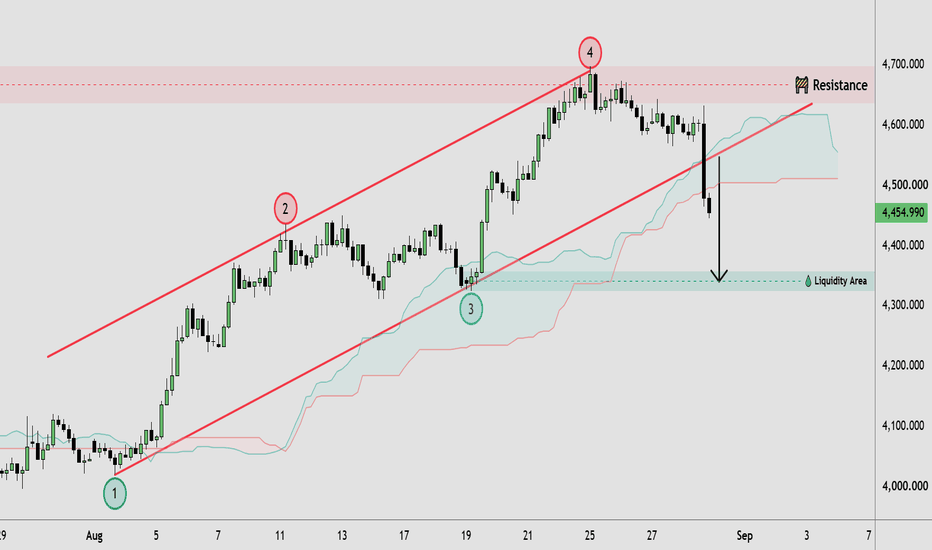
Gold (XAUUSD) Technical Analysis Strategy | Pullbacks are OpportGold (XAUUSD) Technical Analysis Strategy | Pullbacks are Opportunities, Trend Remains Bullish
Gold experienced a significant and rapid decline on Friday, primarily influenced by Federal Reserve Chairman Warsh's hawkish remarks at the Jackson Hole symposium. Market expectations for a September rate hike increased significantly, causing a rapid drop in gold prices.
However, I personally do not believe this decline signifies a reversal in the medium-term trend of gold. On the contrary, after the previous sharp rise, the current situation appears to be a technical correction following profit-taking at higher levels. From a longer-term perspective, continued central bank gold purchases, global fiscal and geopolitical uncertainties, and market expectations for a future shift in US monetary policy remain important medium- to long-term support for gold. Goldman Sachs recently raised its year-end 2026 gold target to $4900/oz, emphasizing that central bank gold purchases remain a key driver.
📊 Technical Analysis
The 1-hour chart clearly shows that gold previously started its upward trend from around 4154, subsequently forming a continuous upward structure and breaking through the head and shoulders bottom pattern, reaching a high of around 4685.
The price has currently retreated from its high of 4685, breaking below the short-term support around 4546. However, the 4433-4392 area is gradually becoming a crucial defensive zone for this correction.
It's particularly noteworthy that the RSI has clearly entered oversold territory, indicating a rapid release of short-term selling pressure. For me, the biggest concern here isn't continuing to short, but rather a potential bullish reversal after gold completes its final bottoming process.
🎯 My Trading Strategy
I maintain my view of primarily buying on dips.
Focus on the 4435-4425 support level. If the price stabilizes here, consider building long positions in batches.
The key support level to watch is around 4390. A decisive break below 4390 would indicate a further expansion of this correction, necessitating a temporary abandonment of the bullish strategy.
The first resistance level to watch is 4545-4550. A break above this level would target 4620-4630. If the bulls recapture 4625, there's still a chance to retest the previous high of 4680-4690.
🏆 XAUUSD BUY: 4435-4425
🛑 SL: 4390
🎯 TP1: 4545
🎯 TP2: 4625
🎯 TP3: 4680
Personally, I prefer to interpret the current decline as a deep correction within an uptrend, rather than a complete trend reversal. With gold, the real opportunity isn't chasing the rally during periods of heightened sentiment, but rather waiting for the price to return to key support levels before looking for a renewed upward push.
⚠️ Of course, in the short term, close attention still needs to be paid to Fed policy expectations and US economic data. If inflation continues to be stronger than expected, gold may still experience significant volatility.
❤️ If you also believe in the future upside potential of gold, please like and follow my page to discuss gold market trends and trading strategies. Let's patiently wait for the next truly worthwhile opportunity to act! Long 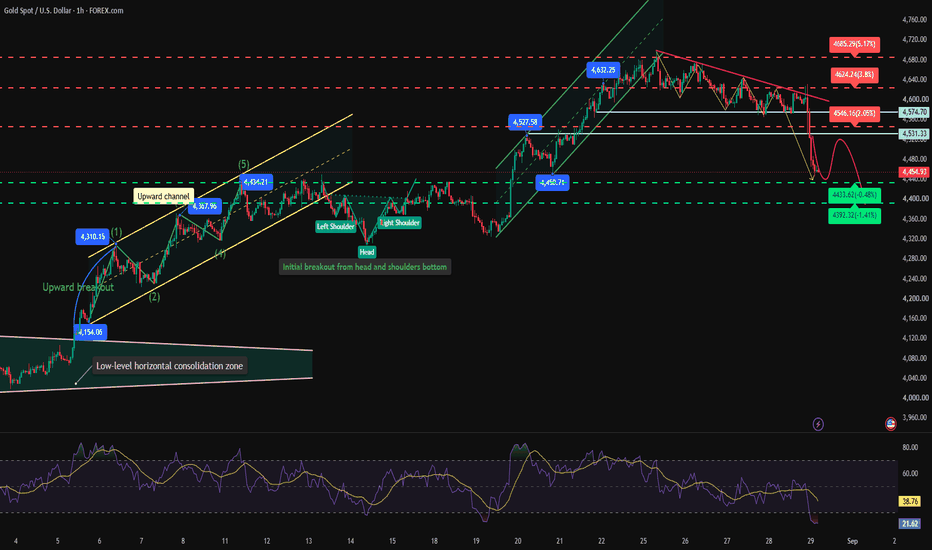
Gold Weekly Review: Surge Meets Resistance, Pullback Begins – CoGold Weekly Review: Surge Meets Resistance, Pullback Begins – Continue to Focus on Selling Next Week!
Dear investors, have a good weekend! 👋 Looking back at this week's gold price movement, the first half of the week saw a strong rally, reaching a high of $4696.7 per ounce, just a step away from the psychological barrier of $4700. However, as we have repeatedly emphasized: there is no market that only rises and never falls; before breaking through, there must be a deep correction.
On Friday, gold prices finally saw a significant pullback. After rebounding to $4618 in the early morning, it encountered resistance. During the US session, it touched a high of $4631 again, but the bulls clearly exhausted their strength. Before the close, it touched a low of $4445, ultimately closing at $4454, resulting in a solid bearish candlestick on the daily chart and a long upper shadow on the weekly chart. 🔻
In my opinion, this pullback is far from over. Technically, it is severely overbought, with a bearish divergence in the daily RSI and a bearish crossover in the 4-hour MACD at a high level, suggesting at least another 200 points of correction is possible. 4700 is not the ceiling, but it is a firm short-term resistance level! We remain firmly bearish, and any rebound is an excellent opportunity to short.
📐 4-Hour Chart Technical Analysis
Current Price: 4454 (Closing Price)
Key Resistance:
First Resistance: 4520-4525 (Short-term dense trading area + 0.236 Fibonacci retracement level)
Strong Resistance Area: 4573-4580 (0.382 Fibonacci retracement level, also the starting point of Friday's US session decline)
Support:
Short-term Support: 4425-4428 (Previous low on a smaller timeframe)
Key Target: 4375 (0.5 Fibonacci retracement level, also the lower Bollinger Band on the 4-hour chart)
Mid-term Target: 4094 (1.618 extension level; a break below this level would open up significant upside potential)
Fibonacci tools clearly show that gold prices have broken below 0.236 (4609) and 0.382 (4555) and are testing below 0.5 (4511). The 0.618 level is at 4467, which the closing price has broken, confirming a trend reversal! The next target is 4375, or even lower. 📉
🧠 Fundamentals: Hawkish comments from Fed officials this week have reignited expectations of a September rate hike, leading to a rebound in the US dollar and Treasury bonds, which continues to put pressure on zero-yield gold.
Funding: A significant drop in volume at the end of Friday's trading session triggered stop-loss orders for long positions, while short positions increased significantly, making a short-term reversal unlikely.
Pattern: A daily "shooting star" pattern and the nascent 4-hour "descending three methods" pattern indicate that the bears are poised to explode next week.
Personally, I believe this pullback will at least reach 4375, and may even test below 4300. Any rebound to the 4520-4580 range is a golden opportunity; don't hesitate, short aggressively! 💣
🎯 Gold Trading Strategy Next Week (Bearish, Strict Risk Management)
Core Idea: Sell on rallies, follow the trend, don't try to catch the bottom, and don't gamble on going long.
Short Position Entry:
Initial Entry: Sell short at 4520-4528, stop loss at 4539 (wait and see if it breaks through), target 4420-4428, break below to around 4380.
Adding to Position: If the price unexpectedly rebounds to 4573-4580, add to the short position, stop loss above 4600, target the same as above.
Long Position Observation (Aggressive Short-Term Only):
If the price drops sharply to 4425-4428 and doesn't break through, a small long position can be attempted, stop loss at 4410, target 4480-4500, quick entry and exit. However, the main trend is bearish, long positions are risky, heavy positions are not recommended.
Medium-Term Strategy:
If the price breaks below 4375 next week, hold the short position targeting the 4300-4250 range, using a trailing stop loss to protect profits.
⚠️ Risk Warning
Markets are constantly changing, and strategies must be adjusted flexibly. If the market gaps up at the open on Monday and holds above 4550, short positions should be temporarily avoided, and decisions should be made only after reaching higher resistance levels. Stop-loss orders are crucial; never hold onto losing positions!
💬 A Final Word
This week's market action once again confirms: the trend is your friend. Now that the pullback structure is clear, we should abandon illusions and embrace the bearish trend. If you agree with my views, please like 👍, comment 💬, save 🔖, and follow my page to get real-time entry points and intraday analysis every day!
See you next Monday when the market opens! Wishing everyone successful trading! 🚀🔥 Short 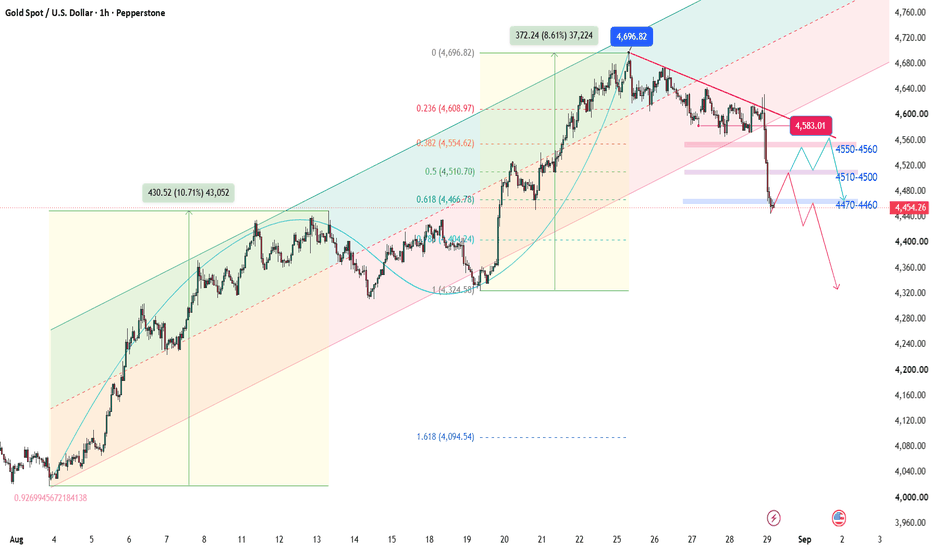
XAU/USD 4H — Bullish Reversal SetupXAU/USD 4H Analysis 📊
🟢 Overall bias: BUY
Market Structure: Bullish — previous BOS confirms upward structure.
Current Setup: Price is pulling back into the 4H support/demand zone around 4,430–4,400.
SMC/ICT: Pullback toward support/liquidity area can provide a potential buy reaction.
Price Action: Descending channel/pullback is approaching the major support area.
Trendline: Long-term ascending trendline is acting as additional support.
Entry: 4,430–4,400 after bullish confirmation/rejection.
SL: Below 4,375
TP1: 4,500
TP2: 4,620
TP3: 4,700 🎯
⚠️ Confirmation: Wait for a bullish candle, CHoCH/BOS on a lower timeframe, or strong rejection from support before entering. Avoid chasing the price.
Key invalidation: A strong 4H close below 4,375 would weaken the bullish setup. Long 
Education 
XAUUSD — Gold: Bullish Reaction From Demand📈 XAUUSD | 15M
Gold is showing a bullish reaction from the 4,588–4,590 demand/support zone, an area that has already produced a strong response on the chart.
My current scenario is for price to continue recovering toward the marked resistance levels, provided the support zone continues to hold.
🎯 Upside levels:
• TP1: 4,632
• TP2: 4,640
• TP3: 4,658
The structure is straightforward: hold the demand zone → reclaim the intermediate resistance levels → test the higher supply area.
⚠️ If price breaks and sustains below 4,588–4,590, this bullish scenario loses validity and I would reassess the setup rather than force the long idea.
This is my technical analysis and a potential market scenario, not a guaranteed outcome or financial advice. Price can invalidate any setup.
🧠 The key area for me right now is the reaction around 4,588–4,590.
What matters next: Can Gold reclaim 4,632 and build acceptance above it? 📊
NOTE: EDUCATIONAL PURPOSES ONLY NOT A FINANCIAL ADVICE. Long 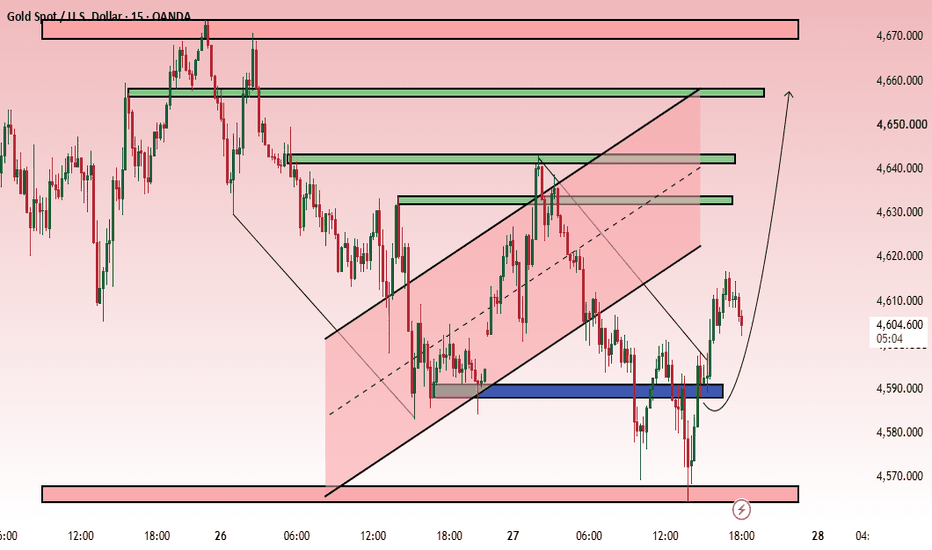
Short 
Education 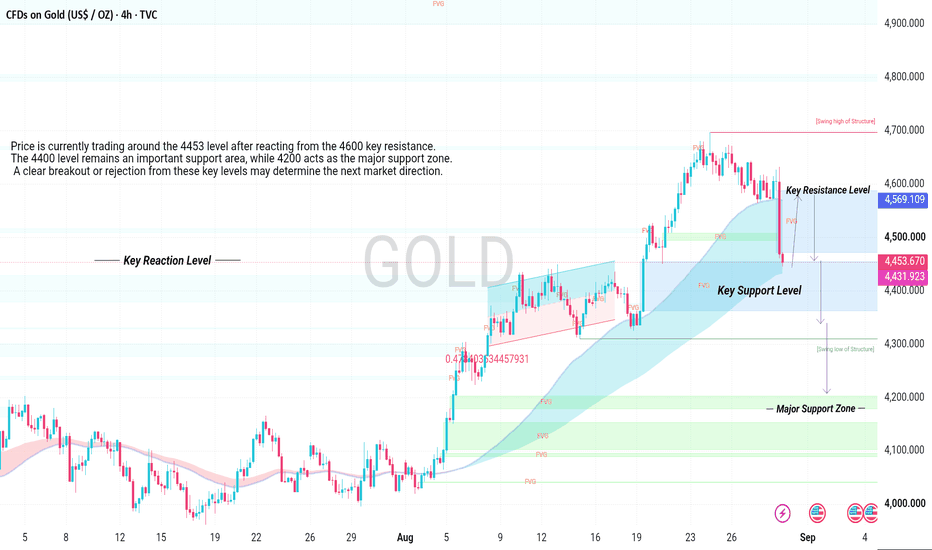
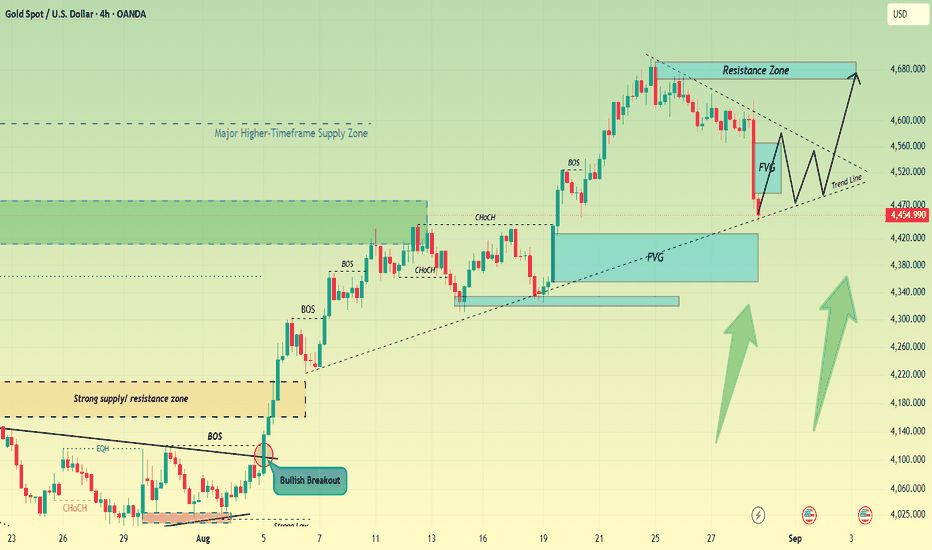
Gold Pulls Back To Trend Line Support After Resistance RejectionNew to charts? Here's the simple version: gold has been climbing for weeks, hit a wall near the highs, and is now pulling back to see if buyers still want in. Let's break down what's happening.
On the 4H XAUUSD chart, gold built a strong rally starting from a Bullish Breakout confirmed back in early August near 4,100. This breakout followed a classic pattern — price swept a "Strong Low," broke above a descending trend line, and then climbed steadily through multiple confirmed structural shifts (BOS and CHoCH, which just mean the market's short-term direction kept flipping bullish).
That rally eventually carried gold into the Resistance Zone near 4,650–4,680 — think of this as a "ceiling" where sellers have shown up before. Just like clockwork, price got rejected here and has now pulled back sharply, currently trading at 4,454.990, down 0.55% on the day.
Here's the interesting part: this pullback is landing right into a fresh FVG (Fair Value Gap) zone near 4,480–4,520 — basically an "unfinished" area from the fast rally that price often comes back to fill. On top of that, there's a rising trend line acting as a "floor" underneath price, adding extra support to this zone.
When a horizontal support zone (the FVG) lines up with a rising trend line, that's called confluence — and it usually makes for a stronger bounce area than either one alone.
If buyers step in here, the projected path points toward a recovery back up through the recent highs, eventually challenging that Resistance Zone again near 4,680.
The key thing to watch: if gold breaks below the trend line (roughly 4,450), that would be a warning sign that buyers are losing control, and a deeper drop could follow.
Do you think gold bounces from this trend line and pushes toward fresh highs, or does the trend line finally break? Long