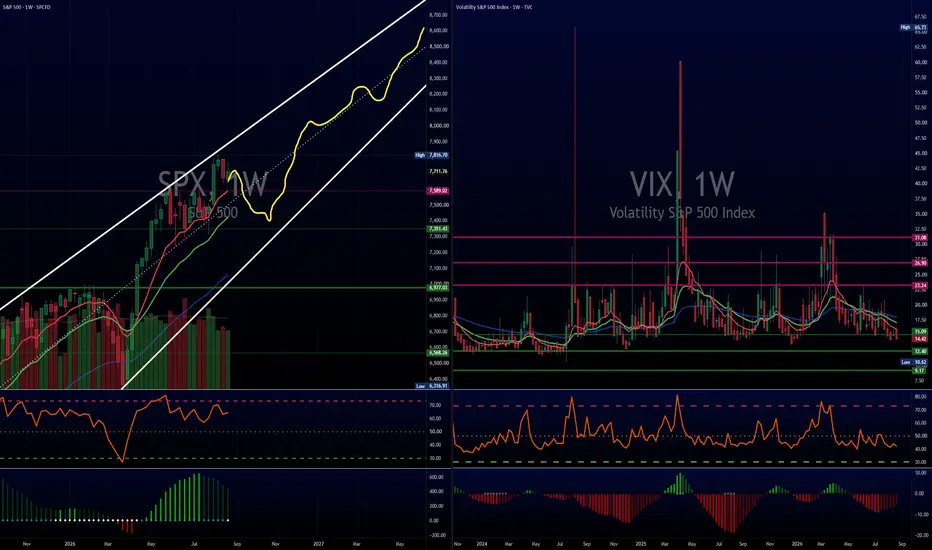
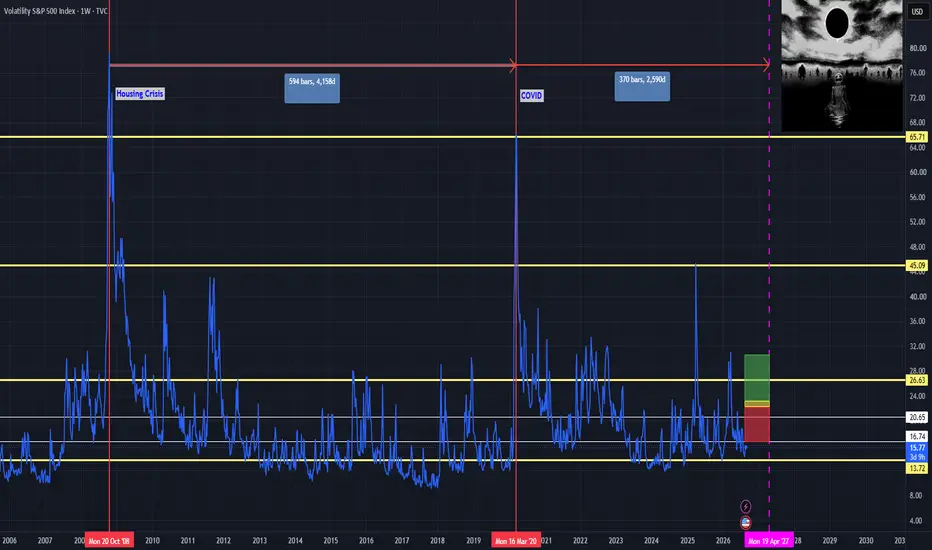
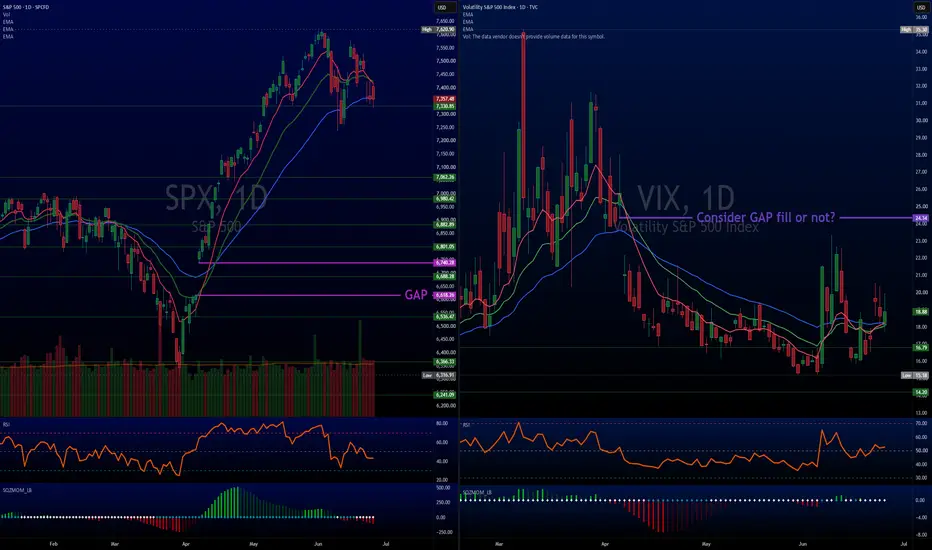
The TINA Blueprint: The Squiggle RoadmapBad news dominates headlines, yet equities refuse to break. The core driver remains institutional capital flow. Big money keeps asking; "where else capital can realistically go?" That dynamic represents the classic TINA backdrop, where There Is No Alternative.
Near term headwinds are building to tr
Volatility S&P 500 Index
No trades
No trades
Compare with Volatility S&P 500
Index info
VIX is the trademarked ticker symbol for the CBOE Volatility Index, a popular measure of the implied market volatility of S&P 500 index options. The VIX index has been calculated by the Chicago Board Options Exchange (CBOE) since 1993.
It is often referred to as the fear index or the fear gauge. The VIX projects a range of the expected stock market volatility over the next 30-day period. It is used by traders, institutional investors, and hedge fund managers to diversify portfolios and correlate returns.
VIX Unfazed After Warsh — 14.77 Is the Line for US500US500 sold off after Chair Warsh’s Jackson Hole speech. VIX barely moved.
That matters. When equities fall and volatility does not confirm, the selling looks more like event digestion than an acceleration of fear. Hike odds for September rose, but VIX failed to hold above 15. The market is not pric
Reading the Tape: Market-Wide Squeeze and the Defensive RotationWhile retail traders chase daily headlines, look at the pure physics of the current market structure. We are experiencing a textbook volatility compression cycle coupled with an aggressive under the surface capital migration.
1. The Macro Squeeze Alignment
If you look across your daily layouts, a r
The Catalyst Wall: Why Caution Is RequiredThe probability of a technical bounce off this lower trendline over the next 2-3 trading sessions sits around, OPINION, 60% to 65%. The technical setup strictly favors a short term reactive pop, but major event risk over the next 48 hours makes any sustained directional follow through a coin flip.
$VIX: Coiling for a Move? 1D & 4H Analysis
Market volatility has spent weeks grinding lower, but the charts are signaling that a shift could be right around the corner.
What the Charts Are Showing:
Strong Floor Defended: Volatility swept down to multi month lows and bounced back. Buyers stepped in to defend the baseline === downside protec
Buy Idea: S&P 500 Volatility Index (VIX)Key Drivers:
The surge in US (and global) bond yields has not been a problem for equities however, intervention by the officials may raise cause for concern.
Our technical screeners (using ETFs) reflect an extreme lack of oversold instruments and a vast number of overbought instruments
S&P 500 In
ORCHESTRA VIEW EP II: Events, Policy And What To WatchFOUR RULES ABOVE EVERYTHING
1. The market is always right.
2. Every price is already set.
3. Every view is a quantum view — stay flexible, keep every state open.
4. All evolution comes through repetition.
The first post in this series took the dollar index apart, measured 42 instruments
on two axe
VIX - Hedge or Spec?Looking at TVC:VIX this week, the opening print of $14.98 struck me as a little odd. You don't have to stick your head out far to see there's more than a fair share of uncertainty around the globe this summer, and for market-oriented folk I am sure by now you are feeling the heat.
The omnipresent
See all ideas
Summarizing what the indicators are suggesting.
Oscillators
Neutral
SellBuy
Strong sellStrong buy
Strong sellSellNeutralBuyStrong buy
Oscillators
Neutral
SellBuy
Strong sellStrong buy
Strong sellSellNeutralBuyStrong buy
Summary
Neutral
SellBuy
Strong sellStrong buy
Strong sellSellNeutralBuyStrong buy
Summary
Neutral
SellBuy
Strong sellStrong buy
Strong sellSellNeutralBuyStrong buy
Summary
Neutral
SellBuy
Strong sellStrong buy
Strong sellSellNeutralBuyStrong buy
Moving Averages
Neutral
SellBuy
Strong sellStrong buy
Strong sellSellNeutralBuyStrong buy
Moving Averages
Neutral
SellBuy
Strong sellStrong buy
Strong sellSellNeutralBuyStrong buy
Displays a symbol's value movements over previous years to identify recurring trends.
Frequently asked questions
The current value of Volatility S&P 500 Index is 14.14 USD — it has risen by 1.18% in the past 24 hours. Track the index more closely on the Volatility S&P 500 Index chart.
Volatility S&P 500 Index reached its highest quote on Oct 23, 2008 — 96.40 USD. See more data on the Volatility S&P 500 Index chart.
The lowest ever quote of Volatility S&P 500 Index is 8.56 USD. It was reached on Nov 24, 2017. See more data on the Volatility S&P 500 Index chart.
Volatility S&P 500 Index value has increased by 3.02% in the past week, since last month it has shown a −2.47% decrease, and over the year it's decreased by −12.82%. Keep track of all changes on the Volatility S&P 500 Index chart.
Volatility S&P 500 Index is just a number that lets you track performance of the instruments comprising the index, so you can't invest in it directly. But you can buy Volatility S&P 500 Index futures or funds or invest in its components.