ASX 200 — The Great Aussie Pie CorrectionASX 200 MAP
Short zone: ~9200
TP1: ~8800
If price bounces, I’m looking for a reload toward ~9450.
Then the larger map is:
8800 → 8600 → 8100
At 8100, reassess.
Monthly momentum has started to roll over, but weekly still has enough strength for one more push higher first. That’s why I’m allowing for the bounce/reload before the deeper correction.
No crystal ball — just the map.
Let’s see how the pie cooks. 🥧😄
----Cay7mon
In-depth trading ideas
AUS200 H4 | Bearish Drop OffBased on the H4 chart analysis, we can see that the price has rejected our sell entry level at 9,020.12, which is a pullback resistance.
Our stop loss is set at 9,110.03, which is a pullback resistance.
Our take profit is set at 8,891.60, which is an overlap support.
High Risk Investment Warning
65% of retail investor accounts lose money when trading CFDs with this provider. You should consider whether you understand how CFDs work and whether you can afford to take the high risk of losing your money.
Title: Australia 200 — Bearish Extension SetupAustralia 200 is currently maintaining a strong bearish structure, with recent price action confirming significant selling pressure across the market. The sharp decline reflects weakening buying interest and stronger participation from sellers, keeping the broader outlook tilted toward the downside.
From a fundamental perspective, the market remains sensitive to expectations around Australian economic growth, interest-rate policy, inflation, employment conditions, commodity demand, and broader global risk sentiment. Any deterioration in the macroeconomic outlook or a shift toward a more defensive market environment can continue to weigh on Australian equities.
Technically, the recent downside move has strengthened the bearish bias. Rather than treating the initial drop as the end of the move, the current structure suggests that sellers may continue to control price action and potentially drive Australia 200 toward further lower levels.
The trade idea remains focused on the selling side, with the expectation that bearish momentum can extend further if price continues to respect the existing structure. The priority is not to chase the move, but to wait for a well-defined opportunity and execute according to the planned method.
Analysis → Confirmation → Execution. 🎯
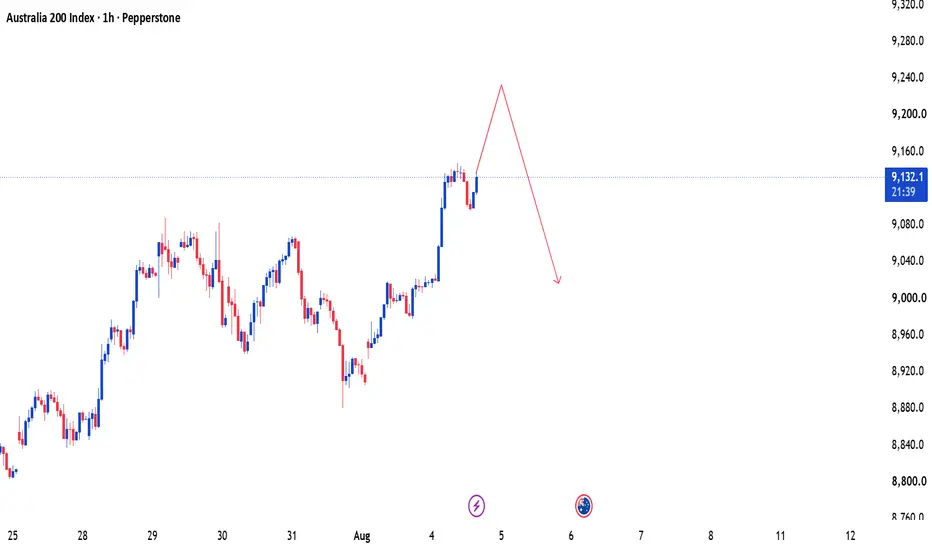
Australia 200 | Short-Term Rise Before a Strong Bearish MoveAustralia 200 may extend slightly higher before shifting lower. The current price structure suggests the upside move could be limited, with the broader expectation favoring a strong decline afterward. The overall outlook remains bearish as sellers are expected to take control of the next leg.
19.08.26 Daily ForecastPairs on Watch -
FX:EURUSD : Very straight forward on this pair as we can see the deliberate 123 structure that has formed into a small 15M hook point. The DXY is positioned at a low where it could hold and go long, meaning EU short. The last leg does have a 123 finishing move into the high, so we have to be aware this could break out higher on the 15M and break back in, giving us a nice 1H risk entry short. If not and price breaks out, potentially a flip on the cards for a long to fill the gap.
OANDA:XAGUSD : On the higher timeframe we can see the main low has been taken out and price is now moving in a larger 123 move to the upside, with a gap to fill at the next inflection point as well, price has more of a reason to go long than short. We have a larger 123 move into a hook point and also retesting previous highs, due to the momentum in the last leg, I will be looking for an insurance entry once the 1H breaks back in.
OANDA:AU200AUD : The higher timeframe is doing its job, after taking out the highs and selling back off into this range, we now have a larger structure forming around the midway point of this range. It is visible on the 4H which means we could get a 4H risk entry here, but also the opportunity to entertain a 1H risk entry for refinement and protect stops above the structure. Target is the next low at the bottom of the overall range.
ASX 200 Rally Hits a WallThe ASX 200 has seen nothing but one-way traffic since hitting record highs, with deteriorating technicals compounded by disappointing results from Australia’s big banks and, today, a very soft earnings report from prominent retailer JB Hi-Fi.
That latter result is potentially important given what it may be telling us about cyclical parts of the economy, coming in the wake of accelerated nationwide falls in house prices, unpopular budget changes and earlier rate increases from the RBA.
As a result of that combination, we’ve seen the index break beneath 9,200, which had previously acted as resistance, before the sell-off accelerated towards 9,063. That was the former swing high from April and also acted as resistance earlier this month.
With the price now sitting just above 9,063, it looms as a potential level to initiate trade setups around depending on how the price action evolves.
Given the direction and speed of the move towards it, along with a bearish MACD crossover earlier today, traders should be on alert for a potential break of 9,063.
If the price were to break beneath 9060 and hold there, one option would be to initiate shorts with a tight stop above for protection, targeting 8,900. That’s where former resistance that flipped to support converges with the rising 50-day simple moving average, and where you can see buyers were active beneath earlier this year.
Of course, if 9,063 holds, there is also the option to initiate longs above the level with a tight stop beneath for protection, targeting a retracement back towards 9,200. If that level were to give way, it would open the door to a retest of the record highs.
However, given the technical and fundamental backdrop, longs screen as the least likely of the setups to succeed.
Good luck!
DS
Australia 200 — ATH Extension Before Bearish ReversalAustralia 200 is currently trading around its All-Time High, where price may push slightly higher before facing strong selling pressure. The expectation is for a final upside extension followed by a bearish reversal from the higher zone.
Rather than chasing the upside at ATH, the focus remains on waiting for the reversal and confirmation before targeting the downside. If the bearish structure develops as expected, Australia 200 could enter a broader corrective move.
Bias: 🔴 Sell / Bearish Reversal
Setup: Swing Sell
Key Area: All-Time High / Higher Extension
Expectation: Slight upside → Reversal → Downside continuation
ASX Retreats From highs, But Trend Remains FirmsI began the day wondering if the ASX could be on the cusp of a bullish breakout from a flag. While that thesis being tested right now, I still see the potential for it to break to new highs in the coming weeks - given the strength if the rally that led thew ASX into its recent record high.
MS
ASX200/AUS200 for over 5 years with strong accuracyTeam,
We’ve been performing consistently well with ASX200 over the last two weeks, especially now that my TradingView ban has finally been lifted. I’ve traded ASX200/AUS200 for over 5 years with strong accuracy and consistent results, and tonight we’re preparing for a clean swing setup.
Here are the levels I’m monitoring:
Short zone: 9086–9125
DOUBLE UP SHORT zone: 9156–9182
Stop level: 9250
Target zones:
Target 1: 9056–9032
Target 2: 9027–8992
Target 3: 8983–8917
This setup is based on experience, psychology, and letting the market finish its pump before reacting. Manage your own risk and volume according to your personal strategy.
LETS GO
your trade your responsibility
AUS200 H4 | Bullish Momentum To ContinueBased on the H4 chart analysis, we can see the price falling to our buy entry level at 8,891.74, an overlap support that is slightly below the 50% Fibonacci retracement.
Our stop loss is set at 8,805.32, a pullback support that aligns with the 78.6% Fibonacci retracement.
Our take profit is set at 9,021.81, a pullback resistance.
High Risk Investment Warning
65% of retail investor accounts lose money when trading CFDs with this provider. You should consider whether you understand how CFDs work and whether you can afford to take the high risk of losing your money.
SX200 / AUS200 SHORT PLANGood morning ALL,
Yesterday I warned everyone NOT to touch the ASX200 short because price could push into 9000 or higher — and that’s exactly what happened, over 100 points up.
Now price has reached the zone we’ve been waiting for.
I’m watching this area closely for potential short reactions if the market confirms.
Please manage your own volume and risk.
Primary Short Zone: 9010 – 9026
Add‑More Zone: 9045 – 9065
STOP LOSS (Risk Marker): 9115
Target 1: 8986 – 8972
Target 2: 8986 – 8945
Target 3: 8938 – 8886
LETS GO
ASX200 / AUS200 PREPARATION UPDATETeam, ASX200 has pushed into the zone we’ve been monitoring throughout the session.
This area has shown weakness before, and I’m watching it closely for potential short reactions if the market confirms.
Here are the levels I’m observing for momentum shifts and reaction zones.
Primary Short: 8905–8935
DOUBLE‑UP Observation Zone: 8965–8986
STOP LOSS : 9050
TARGET 1 8876–8862
TARGET 2: 8857–8832
LETS GO
ACTIVE Signal — Risk First. Profit Second.
Your trade, your responsibility. Please manage your own volume and risk.
ASX200/AUS200 - TIME FOR LONG ENTRYTEAM — AUS200 LONG SETUP 🔥
Team, yesterday we executed our SHORT at 8915–8930, and the move delivered 100–120 points clean.
Since then, the market has flushed over 180 points, giving us the perfect opportunity to flip and position for the next leg.
LONG ENTRY ZONE: 8750 – 8730
ADDITIONAL LONGS: 8686 – 8666
STOP LOSS: 8620
Target 1: 8782 – 8796
Target 2: 8808 – 8836
Take partials at T1, secure profits, and let the rest breathe.
Buyers are likely to step in around our zones
LETS GO
AUS200 H1 | Falling Toward Fib LevelBased on the H1 chart, we could see the price fall to our buy entry level at 8,840.24, an overlap support that aligns with the 38.2% and the 61.8% Fibonacci retracement and the 78.6% Fibonacci projection.
Our stop loss is set at 8,797.49, which is an overlap support that is slightly above the 61.8% Fibonacci retracement.
Our take profit is set at 8,899.44, which is a pullback resistance.
High Risk Investment Warning
Stratos Markets Limited fxcm.com Stratos Europe Ltd, fxcm.com CFDs are complex instruments and come with a high risk of losing money rapidly due to leverage. 69% of retail investor accounts lose money when trading CFDs with this provider. You should consider whether you understand how CFDs work and whether you can afford to take the high risk of losing your money.
Stratos Global LLC fxcm.com Losses can exceed deposits.
Please be advised that the information presented on TradingView is provided to FXCM (‘Company’, ‘we’) by a third-party provider (‘TFA Global Pte Ltd’). Please be reminded that you are solely responsible for the trading decisions on your account. Any information and/or content is intended entirely for research, educational and informational purposes only and does not constitute investment or consultation advice or investment strategy. The information is not tailored to the investment needs of any specific person and therefore does not involve a consideration of any of the investment objectives, financial situation or needs of any viewer that may receive it. Past performance is not a reliable indicator of future results. Actual results may differ materially from those anticipated in forward-looking or past performance statements. We assume no liability as to the accuracy or completeness of any of the information and/or content provided herein and the Company cannot be held responsible for any omission, mistake nor for any loss or damage including without limitation to any loss of profit which may arise from reliance on any information supplied by TFA Global Pte Ltd.
Stratos Trading Pty. Limited fxcm.com Trading FX/CFDs carries significant risks. FXCM AU (AFSL 309763), please read the Financial Services Guide, Product Disclosure Statement, Target Market Determination and Terms of Business at fxcm.com
ASX200/AUS200 - time to SHORTTeam, stay sharp — structure is clean and we’re preparing for a controlled short position.
Follow the levels exactly, no rushing, no early entries.
SHORT ENTRY ZONE: 8906 – 8918
Let price tap into the range before executing.
ADD MORE SHORTS: 8946 – 8965
This is our second layer — controlled volume, disciplined execution.
STOP LOSS: 9050
Target 1: 8876 – 8865
Target 2: 8856 – 8838
Take partials at T1, protect capital, and let the rest breathe.
LETS GO
NOTE:Dear PAMM investor,
As mentioned last night, there was a possibility to reach 3% if I had closed the UK100 position at the right moment. Unfortunately, I woke up about 5 minutes late, and the market had already closed. Because of that, we finished yesterday with a solid 2.6% gain.
As promised, today I aimed to secure 1% when the market opened — and the plan played out exactly as expected. The structure was clean, the execution was disciplined, and we reached our target.
Thank you for your trust and continued support.
Risk first, profit second — always.
Australia 200 Eyes Buy-Side ExpansionAustralia 200 is holding near an important support zone after recent selling. If buyers remain active, the market could move higher and target buy-side liquidity.
A weaker US Dollar and better market sentiment may also support the next bullish move. Wait for confirmation before entering and always manage your risk.
ASX200 / AUS200 LONG SETUPTeam, stay focused — the structure is clean and we have a two‑stage entry plan today.
PRIMARY ENTRY ZONE: 8745 – 8726
ADDITIONAL BUY ZONE: 8686 – 8665
No rushing. No early entries. Let price tap our zones. Otherwise we can trade tomorrow during AUSTRALIAN market opening.
STOP LOSS: 8615
Target 1: 8776 – 8786
Target 2: 8792 – 8826
Once T1 hits, protect capital and let the rest breakeven
LETS GO
ASX 200 eyeing a pattern breakoutWe have some interesting price action brewing on the ASX 200.
Although a pullback from 8,983 occurred following the break of a double-bottom pattern’s neckline at 8,811, price is beginning to find a footing without breaching the pattern’s lows of around 8,485. The pattern’s profit objective is still calling for attention at 9,128.
Additionally, you may acknowledge the potential inverted head-and-shoulders pattern now forming, with the neckline at 8,900. A break above here may help reaffirm bullish intent from the double-bottom formation, targeting the said profit objective of 9,128.
Written by FP Markets Chief Market Analyst Aaron Hill
AUS200
Same logic. Applied across every instrument.
Price over everything.
Every headline, every rumor, every report, and every opinion is reflected in price.
This AUS200 setup is built on one thing only. Pure price action. No indicators. No noise.
The footprints are there for those who know where to look. Structure, liquidity, and market reaction tell the story long before the news does.
I trade what price reveals, not what people predict.
Price is the only language I need.
Price Left Clues👣