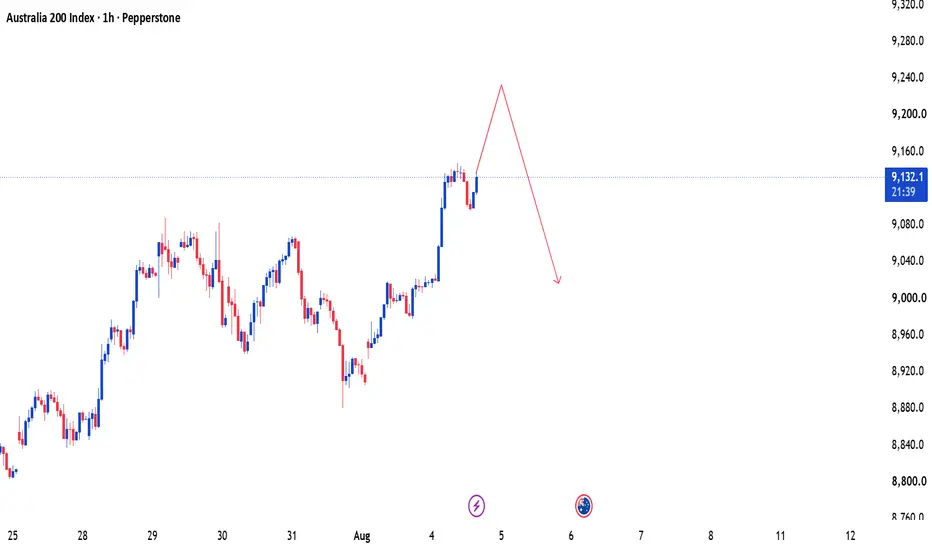
ASX 200 — The Great Aussie Pie CorrectionASX 200 MAP
Short zone: ~9200
TP1: ~8800
If price bounces, I’m looking for a reload toward ~9450.
Then the larger map is:
8800 → 8600 → 8100
At 8100, reassess.
Monthly momentum has started to roll over, but weekly still has enough strength for one more push higher first. That’s why I’m allowi
S&P/ASX 200 Index
No trades
No trades
Compare with S&P/ASX 200
Index info
The S&P/ASX200 is an index that represents the 200 top stocks based on their weighted market capital in the Australian stock market "Australian Securities Exchange". The index represents 72% of the total market value of all the stocks traded in the Australian Securities Exchange. The trading hours for the ASX 200 index takes place from 10:00 a.m. to 4:00 p.m. Sydney time. This index was created back in 2000 and it started with a value of 3,133.3. The 2015 market capitalization of the index amounts to A$ 1.1 trillion, which sets it around the same market capitalization with some of the major indexes of Europe. The ASX200 is an indicator that gauges the performance of the Australian stock market and this indicator could be used as a guide by investors that want to understand how the biggest economy in Oceania is performing.
AUS200 H4 | Bearish Drop OffBased on the H4 chart analysis, we can see that the price has rejected our sell entry level at 9,020.12, which is a pullback resistance.
Our stop loss is set at 9,110.03, which is a pullback resistance.
Our take profit is set at 8,891.60, which is an overlap support.
High Risk Investment Warning
Title: Australia 200 — Bearish Extension SetupAustralia 200 is currently maintaining a strong bearish structure, with recent price action confirming significant selling pressure across the market. The sharp decline reflects weakening buying interest and stronger participation from sellers, keeping the broader outlook tilted toward the downside.
Australia 200 | Short-Term Rise Before a Strong Bearish MoveAustralia 200 may extend slightly higher before shifting lower. The current price structure suggests the upside move could be limited, with the broader expectation favoring a strong decline afterward. The overall outlook remains bearish as sellers are expected to take control of the next leg.
19.08.26 Daily ForecastPairs on Watch -
FX:EURUSD : Very straight forward on this pair as we can see the deliberate 123 structure that has formed into a small 15M hook point. The DXY is positioned at a low where it could hold and go long, meaning EU short. The last leg does have a 123 finishing move into the high, so
ASX 200 Rally Hits a WallThe ASX 200 has seen nothing but one-way traffic since hitting record highs, with deteriorating technicals compounded by disappointing results from Australia’s big banks and, today, a very soft earnings report from prominent retailer JB Hi-Fi.
That latter result is potentially important given what
Australia 200 — ATH Extension Before Bearish ReversalAustralia 200 is currently trading around its All-Time High, where price may push slightly higher before facing strong selling pressure. The expectation is for a final upside extension followed by a bearish reversal from the higher zone.
Rather than chasing the upside at ATH, the focus remains on w
ASX Retreats From highs, But Trend Remains FirmsI began the day wondering if the ASX could be on the cusp of a bullish breakout from a flag. While that thesis being tested right now, I still see the potential for it to break to new highs in the coming weeks - given the strength if the rally that led thew ASX into its recent record high.
MS
ASX200/AUS200 for over 5 years with strong accuracyTeam,
We’ve been performing consistently well with ASX200 over the last two weeks, especially now that my TradingView ban has finally been lifted. I’ve traded ASX200/AUS200 for over 5 years with strong accuracy and consistent results, and tonight we’re preparing for a clean swing setup.
Here are t
See all ideas
Summarizing what the indicators are suggesting.
Oscillators
Neutral
SellBuy
Strong sellStrong buy
Strong sellSellNeutralBuyStrong buy
Oscillators
Neutral
SellBuy
Strong sellStrong buy
Strong sellSellNeutralBuyStrong buy
Summary
Neutral
SellBuy
Strong sellStrong buy
Strong sellSellNeutralBuyStrong buy
Summary
Neutral
SellBuy
Strong sellStrong buy
Strong sellSellNeutralBuyStrong buy
Summary
Neutral
SellBuy
Strong sellStrong buy
Strong sellSellNeutralBuyStrong buy
Moving Averages
Neutral
SellBuy
Strong sellStrong buy
Strong sellSellNeutralBuyStrong buy
Moving Averages
Neutral
SellBuy
Strong sellStrong buy
Strong sellSellNeutralBuyStrong buy
Displays a symbol's value movements over previous years to identify recurring trends.
Frequently asked questions
S&P/ASX 200 Index reached its highest quote on Aug 6, 2026 — 9,296.7 POINT. See more data on the S&P/ASX 200 Index chart.
The lowest ever quote of S&P/ASX 200 Index is 443.1 POINT. It was reached on Jul 8, 1982. See more data on the S&P/ASX 200 Index chart.
S&P/ASX 200 Index value has decreased by −0.36% in the past week, since last month it has shown a −1.53% decrease, and over the year it's increased by 3.06%. Keep track of all changes on the S&P/ASX 200 Index chart.
The champion of S&P/ASX 200 Index is ASX:MI6 — it's gained 462.07% over the year.
The weakest component of S&P/ASX 200 Index is ASX:TUA — it's lost −71.78% over the year.
S&P/ASX 200 Index is just a number that lets you track performance of the instruments comprising the index, so you can't invest in it directly. But you can buy S&P/ASX 200 Index futures or funds or invest in its components.
The S&P/ASX 200 Index is comprised of 199 instruments including ASX:BHP, ASX:CBA, ASX:RIO and others. See the full list of S&P/ASX 200 Index components to find more opportunities.