 Long
Long
AAVE Is Outperforming Bitcoin. Mapping The Retracement.The most favorable regime for altcoins isn't just Bitcoin trending higher—it is Bitcoin rising on macro timeframes while Bitcoin Dominance cools off .
That is precisely when assets with genuine relative strength expand the fastest.
Relative Strength : CRYPTOCAP:AAVE AAVE / INDEX:BTCUSD BTC Context
Before looking at the USD chart, the primary story is happening on the BINANCE:AAVEBTC AAVE/BTC pair:
On the daily timeframe, AAVE/BTC has officially broken out of a multi-month descending channel with strong RSI divergence.
This indicates that AAVE isn't simply rising due to overall market inflation—it is actively capturing market share from Bitcoin itself.
Technical Structure: Inverse Head & Shoulders Completed
On the AAVE/USDT chart, price recently fulfilled the complete measured move of a classic Inverse Head and Shoulders pattern :
After hitting the exact pattern target near $148, price entered a natural cooling-off phase.
Fibonacci Retracement & Key Levels
Price is currently retesting the 0.382 Fibonacci retracement level near $128.0, offering a much better location for structural buyers than chasing the initial breakout top.
First Retest Level (0.382 Fib): ~$128.0
Secondary Retest Level (0.50 Fib): ~$120.0
Short-Term Target: $148.0
Mid-Term Target: $165.0
Invalidation Level: $112.0 (0.618 Fib)
Risk Perspective
In strong impulse trends, price often respects shallow retracements (the 0.382 to 0.50 Fib region).
However, the 107.0 level (the 0.618 Golden Pocket) serves as our hard line in the sand. If price breaks and closes below $107.0, the immediate bullish momentum thesis is invalidated, suggesting a deeper structural reset is required.
We do not guess the exact bottom of a pullback.
We mark the key Fib boundaries, wait for lower-timeframe price action confirmation, and manage risk strictly.
Patience before execution.
Risk Warning:
Trading cryptocurrencies involves significant financial risk.
This analysis represents a personal structural view, not financial advice.
Always define your risk before entering any trade and never risk capital you cannot afford to lose.  Long
Long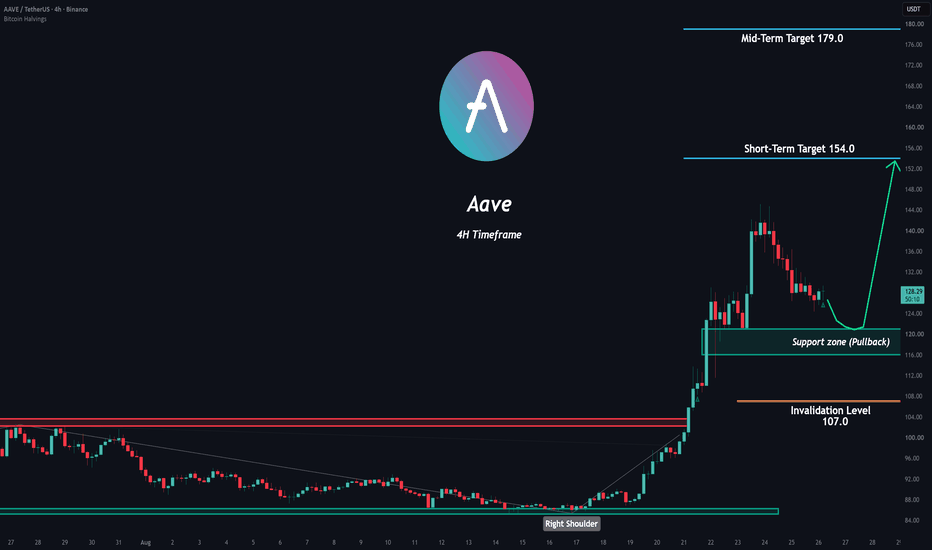
TradeCityPro | Bitcoin Daily Analysis #355👋 Welcome to TradeCity Pro!
Let’s analyze Bitcoin. Buying volume has entered the market today, and there is a possibility of a sharp move.
⌛️ 1 Hour Time Frame
Bitcoin is currently below a very strong and solid resistance level. This resistance is at 80778. Price has tested this level once before, and now it is trying to break it for the second time.
📊 Buying volume has increased over the past few candles, and RSI is also close to the overbought zone. If this increase in volume continues and RSI manages to consolidate inside the overbought zone, we could see the next bullish wave in Bitcoin.
⚖️ So, a break and consolidation above 80778 would give us a long position, and we can open a position once this level is broken.
💡 For now, I’m not looking for any short positions in the market. For a short position, I’ll wait for a trend reversal. At the moment, it’s better to trade in the direction of the trend.
❌ Disclaimer ❌
Trading futures is highly risky and dangerous. If you're not an expert, these triggers may not be suitable for you. You should first learn risk and capital management. You can also use the educational content from this channel.
Finally, these triggers reflect my personal opinions on price action, and the market may move completely against this analysis. So, do your own research before opening any position.  Long
Long
 Long
Long
WIF memecoin with 30x potential?For a long time, CRYPTOCAP:WIF looked dead, but now it’s starting to show the first signs of life, while strongly outperforming many other memecoins in growth speed.
And considering how globally oversold it is, this memecoin has huge potential.
Here’s what I see on the chart:
1️⃣ CMF is showing the highest capital inflow in a year, which means big players have already started aggressively accumulating positions.
This is also confirmed by the Supply Zones indicator, which shows that a large cluster of buyer liquidity has formed right below the current price.
2️⃣ If people are ready to buy even at current prices, it means they see WIF as undervalued by the market, even after a 60%+ pump.
3️⃣ However, Dynamic RSI is showing local overbought conditions even on the daily chart. Together with the fact that price has reached the order block around $0.25–$0.22, this suggests we may soon see a small local correction.
➡️ The first correction zone I’m watching is $0.18, the beginning of that same large liquidity cluster where strong buyer support is located. And this is also the first good level to accumulate positions if you’re not in the coin yet.
In the next bull cycle, I expect very strong performance from CRYPTOCAP:SOL , and CRYPTOCAP:WIF is one of its main memecoins.
Just a return to its ATH would give it around 30x potential 📈
 Long
Long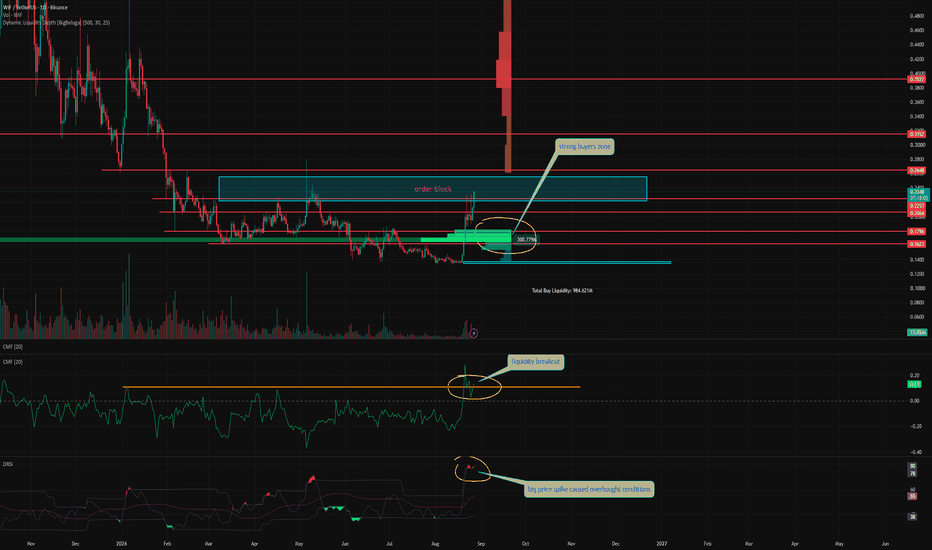
Long 
 Short
Short
Why the Active Continuation Zone Moves ForwardA continuation map is not meant to keep every old zone equally important forever. As structure progresses, the active reference can move forward.
That is the main idea in this SOL example.
────────────────────────────
WHY THIS CHART IS USEFUL
────────────────────────────
On this 1H chart, the script is running in Auto mode with 4H structure in the background. That means the candles on screen are 1H, but the continuation logic is still being built from completed 4H structure.
What makes this chart useful is that it shows more than one bullish continuation zone in sequence. An older bullish zone remains visible lower on the chart as faded history, while a newer bullish zone sits much closer to current price. Price then continues higher and prints another bullish continuation break above it.
That makes the structural progression easy to see.
────────────────────────────
THE IMPORTANT DISTINCTION
────────────────────────────
A historical zone and an active zone are not the same thing.
The faded bullish zone lower on the chart still matters as part of the market’s history. It shows where a previous continuation phase was confirmed. But once price has progressed and newer qualifying continuation structure forms higher up, the active structural reference can shift forward.
In other words, the map is not forgetting the old zone. It is simply updating which zone is most relevant now.
────────────────────────────
WHY THE ACTIVE ZONE MOVES
────────────────────────────
Continuation logic is sequential. A new bullish continuation phase can create a newer valid origin zone after the market has already moved on from the earlier one.
That matters because the script is not trying to preserve every past zone as if nothing changed. It is trying to reflect the current structural state.
In practice, an older zone can stop being active for several reasons, including invalidation, expiry, or being superseded by newer qualifying structure. The key point in this chart is not which historical label changed first. The key point is that the active map has clearly moved forward with price.
────────────────────────────
WHAT THIS SOL CHART SHOWS
────────────────────────────
Here, the older bullish zone sits lower in the trend and remains visible as faded history. A newer bullish zone later forms higher up, closer to the current auction. After that, price continues to expand and prints another bullish continuation break.
That sequence tells a cleaner story than a chart with only one isolated zone. It shows that continuation structure is not static. The active map can update as the trend develops.
So if someone looks at the chart and asks, “Why is that older zone faded while a newer one is active?”, the answer is simple: the structure advanced, and the active continuation reference advanced with it.
────────────────────────────
COMMON MISREAD
────────────────────────────
One common mistake is to assume that once a bullish continuation zone appears, it should remain the main reference until price fully breaks it.
That is not how a continuation map has to work.
A zone can still be part of the historical framework without remaining the primary active reference. Once newer valid structure forms, the chart can legitimately shift attention toward the newer zone instead.
────────────────────────────
PRACTICAL TAKEAWAY
────────────────────────────
When you read continuation structure, do not ask only, “Where was the first zone?”
Also ask, “Which zone is active now, and why?”
That is the more useful question. The answer often tells you whether the trend is still progressing cleanly or whether the map has stopped updating.
In this SOL example, the structure continued to progress, and the active continuation zone moved forward with it.
Structure observations, not signals. Education 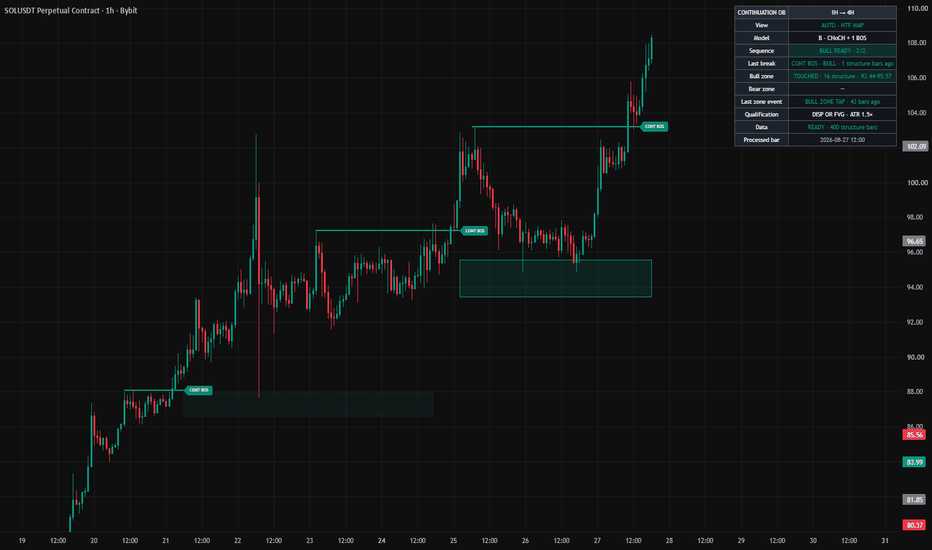
Market Concepts · Lesson 13 — SFP + Liquidity ComboLesson 13 - Swing Failures at Liquidity Pools: Two Reversal Signals Combined
Difficulty: Advanced
A swing failure on its own is powerful. A swing failure right at a known liquidity pool is one of the cleanest reversal signals the market gives you — because two independent tools are pointing at the same trap at the same time.
🔵 WHY THIS COMBO MATTERS
You already know how each signal works on its own. An SFP shows you where the market wicked past a swing point and closed back inside — a trap for late breakout traders. A liquidity zone marks the exact price area where stops and pending orders are sitting, waiting to be triggered.
When these two signals appear in the same spot, something more meaningful happens. The wick that produced the SFP isn't a random poke past a random level — it's a wick that specifically swept a known liquidity pool. The trap has real fuel behind it, because real stops just got triggered.
That combination is why SFPs at liquidity zones tend to produce sharper, more reliable reversals than either signal alone.
🔵 HOW TO SPOT THE SETUP
The setup builds in three stages:
- First, identify an unswept liquidity zone on your chart — a Buyside zone below or a Sellside zone above
- Wait for price to reach that zone. The market is drifting toward the fuel — this is the setup phase
- Watch for the sweep — a wick that pushes through the zone and closes back inside. That's the SFP forming right at the liquidity pool
Here's the moment the sweep happens — price wicks into the liquidity zone, takes out the resting orders, and closes back inside the range:
And here's what tends to follow — a decisive move away from the swept level, powered by the fuel the sweep just harvested:
🔵 TRADING THE SETUP
Because the setup carries two forms of confluence, entries can be more aggressive than with a standalone SFP:
- Entry: after the sweep candle closes back inside the range, on the next candle showing rejection
- Stop-loss: beyond the extreme of the sweep wick (giving the trade room while defining risk clearly)
- Target: set by structure — a prior swing point, an opposing liquidity zone, or a fresh order block on the other side
The key advantage: because the SFP happened AT a liquidity level (not just anywhere), the reversal has real fuel behind it. Reactions tend to be faster and more decisive than a random SFP would produce.
🔵 COMMON MISTAKES TO AVOID
- Forcing the pattern when only one signal is present — a wick that closes back inside a candle doesn't count as an SFP+liquidity setup if there's no liquidity zone at that level
- Entering the sweep too early — wait for the wick to close back inside the range before committing
- Ignoring the higher-timeframe trend — a bullish sweep-and-reverse setup inside a strong daily downtrend is still fighting the trend
- Placing stops too tight — the sweep wick defines your risk area; don't put your stop inside the wick itself
🐳 PRO TIPS
- The larger the liquidity pool that got swept, the stronger the reversal tends to be — sweeps at higher-timeframe zones carry disproportionate weight
- If the sweep + SFP setup also lines up with an order block or FVG on the other side of the range, you have triple confluence, and the setup deserves your highest conviction
- After a successful sweep-and-reverse setup, the swept level itself often becomes a reference point that price respects on later pullbacks
- The cleanest examples happen at obvious swing points that everyone can see — that's where the most stops are stacked, and that's where the sweep does the most damage
Combining SFPs with liquidity is one of the higher-precision setups in the whole SMC toolkit — once you spot the pattern once, you start seeing it everywhere.
Market Concepts — All Lessons
Lesson 01 — What Order Blocks Are
Lesson 02 — Zone Strength Isn't About Size
Lesson 03 — Entering Trades With Order Blocks
Lesson 04 — Old Order Blocks As New S/R
Lesson 05 — Breaker Blocks
Lesson 06 — HTF Blocks With LTF Entries
Lesson 07 — BOS vs Change of Character
Lesson 08 — Structure Quality: Strong vs Weak
Lesson 09 — Fair Value Gaps
Lesson 10 — Order Blocks + FVG Confluence
Lesson 11 — Swing Failure Patterns (SFP)
Lesson 12 — Buyside & Sellside Liquidity
Best Regards, BigBeluga 🐳 Education 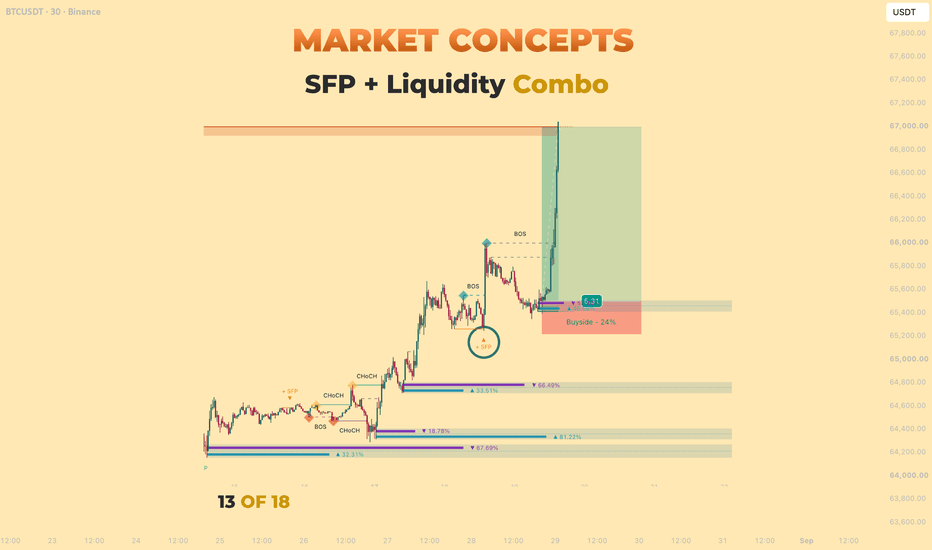
Long 
Holding $80K keeps $82.5K in playHey traders! 👾✊🏼
For 8 consecutive sessions, we’ve seen significant capital inflows into U.S. spot crypto ETFs, with total inflows now reaching an impressive $3.8B 💰💰💰
As I mentioned earlier, this rally is no longer being driven solely by short covering. We’re also seeing continued institutional demand supporting the move.
So, what’s happening on the chart right now? 🧐
It’s pretty clear that the bulls have no intention of giving up control just yet. Price is currently trying to establish itself above the upper boundary of the $76–80K trading range.
In my last post, I wrote:
🦬🚀 “Holding the $78K level followed by a breakout above $80K will almost certainly send price toward a local high breakout and the $82.5K level.”
That scenario is playing out right now, and we could very well see $82.5K in the near future.
🐻🪓However, despite what looks like the best possible news, growing euphoria, and billions of dollars flowing into Bitcoin ETFs, Bitcoin can always paint the opposite picture. So keep the bearish scenario in mind as well.
If the current breakout above $80K turns out to be a fakeout, price could quickly fall back toward the middle of the range at $78K.
I’ve already outlined the next scenario:
“Failure to hold $78K would weaken the bulls’ position and could quickly send price toward the lower boundary of the range at $76K. A break below $76K would open the door for bears to extend the correction toward $73.7K.”
Peace! 🌄
⚠️ Disclaimer:
All information shared on this channel is for educational and informational purposes only and is not investment advice. The author is not responsible for your trading decisions. Always manage your risks and make decisions independently. Long 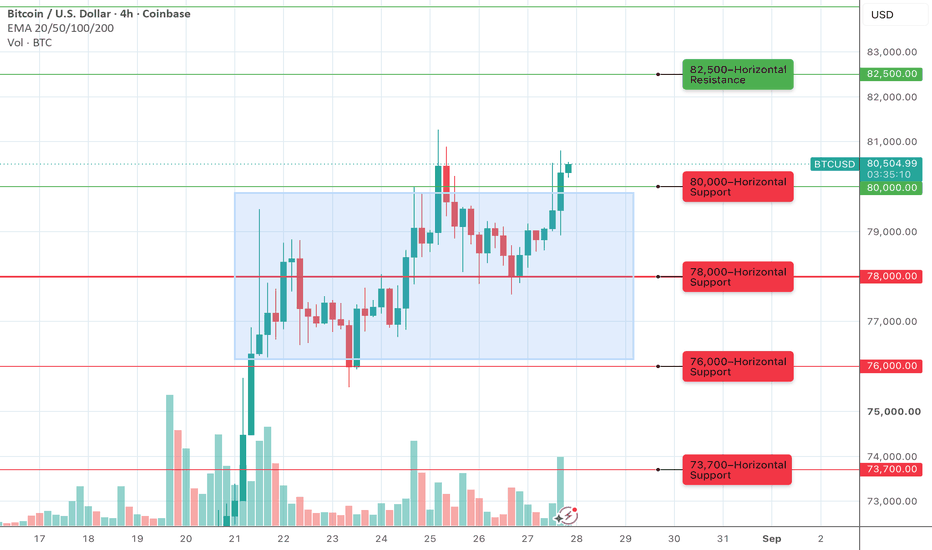
 Long
Long
XRP: Evaluating the Current Resistance StructureXRP price action has established a weekly bullish engulfing candle, signalling a shift in momentum that warrants attention within the current market structure. Price is now attempting to move through an established order block resistance, making this an important area for confirmation.
If XRP can trade and establish acceptance above the current order block, the technical structure could open the probability of a bullish expansion toward the $2 resistance area. Such a move would still depend on sustained acceptance above the resistance rather than a temporary move through it.
Conversely, if price fails to overcome the order block and experiences a clear rejection, the market could shift back toward a corrective structure. In that scenario, the $0.99 area becomes a potential downside reference, particularly if selling pressure increases and the weekly bullish structure begins to weaken.
The relationship between the current order block and subsequent weekly closes will therefore be important. A sustained breakout could strengthen the bullish scenario, while rejection and a loss of nearby support could increase the probability of a deeper retracement.
For now, the setup remains conditional. The weekly bullish engulfing candle provides a constructive signal, but confirmation from price acceptance above resistance or a breakdown of support is required before either scenario gains greater technical weight.
-----------------------------------------------------------------------------------------------
Don't invest unless you're prepared to lose all the money you invest. This is a high-risk investment and you should not expect to be protected if something goes wrong. Take 2 mins to learn more: coinjar.com
The article is an opinion expressed by the author at a point in time and does not represent the views of CoinJar UK Limited or CoinJar Australia Pty Ltd. Take care to consider the date of this article and be aware that this opinion is based on circumstances at the time of publishing. No responsibility or liability is accepted for any errors of fact or omission expressed therein. Past performance is not a reliable indicator of future results.
This above article is not to be read as investment, legal or tax advice and it takes no account of particular personal or market circumstances; all readers should seek independent investment advice before investing in cryptocurrencies.
We recommend you obtain financial advice before making a decision to use your credit card to purchase cryptoassets or to invest in cryptoassets.In the UK, it's legal to buy, hold, and trade crypto, however cryptocurrency is not regulated in the UK. It's vital to understand that once your money is in the crypto ecosystem, there are no rules to protect it, unlike with regular investments.
You should not expect to be protected if something goes wrong. So, if you make any crypto-related investments, you're unlikely to have recourse to the Financial Services Compensation Scheme (FSCS) or the Financial Ombudsman Service (FOS) if something goes wrong.
---------------------------------------------------------------------------------------------- Litecoin: Assessing the Multi-Year Range StructureLitecoin (LTC) price action continues to trade within a large multi-year range, with recent movement raising the possibility of a reclaim of the range’s lower boundary. The key area to monitor is the range-low deviation, where price has previously moved below the established range before recovering.
A deviation below a range can indicate that sellers were unable to sustain downside momentum at lower levels. If LTC can establish and maintain further weekly closes above the deviation level, it would provide greater evidence that price is being accepted back inside the broader range. This would shift the technical structure toward a continuation of the existing ranging environment rather than confirming a sustained breakdown.
Should acceptance within the range develop, the range high would become the broader structural reference point over the coming months. However, this remains a probability-based scenario rather than a confirmed outcome. Price would still need to demonstrate sustained acceptance above the lower boundary, while a move back below the deviation could weaken the reclaim thesis.
For now, the most important consideration is how LTC responds around the range-low deviation and whether subsequent weekly candles confirm acceptance. Monitoring these levels may provide greater clarity on whether the multi-year range remains intact.
-----------------------------------------------------------------------------------------------
Don't invest unless you're prepared to lose all the money you invest. This is a high-risk investment and you should not expect to be protected if something goes wrong. Take 2 mins to learn more: coinjar.com
The article is an opinion expressed by the author at a point in time and does not represent the views of CoinJar UK Limited or CoinJar Australia Pty Ltd. Take care to consider the date of this article and be aware that this opinion is based on circumstances at the time of publishing. No responsibility or liability is accepted for any errors of fact or omission expressed therein. Past performance is not a reliable indicator of future results.
This above article is not to be read as investment, legal or tax advice and it takes no account of particular personal or market circumstances; all readers should seek independent investment advice before investing in cryptocurrencies.
We recommend you obtain financial advice before making a decision to use your credit card to purchase cryptoassets or to invest in cryptoassets.In the UK, it's legal to buy, hold, and trade crypto, however cryptocurrency is not regulated in the UK. It's vital to understand that once your money is in the crypto ecosystem, there are no rules to protect it, unlike with regular investments.
You should not expect to be protected if something goes wrong. So, if you make any crypto-related investments, you're unlikely to have recourse to the Financial Services Compensation Scheme (FSCS) or the Financial Ombudsman Service (FOS) if something goes wrong.
---------------------------------------------------------------------------------------------- Long 
Solana: Key Levels Define the Next RangeSolana price action has recently printed a bullish engulfing candle on the weekly timeframe, accompanied by a notable increase in bullish volume. This development has coincided with a break above key resistance levels and a shift in the local market structure, indicating that the market has transitioned into a new trading range.
With the structure now established, the $139 level represents the next significant resistance to monitor. On the downside, $96 is the key support level that remains important for maintaining the current structure. As long as price action continues to hold above $96, the market retains the possibility of extending its current move towards the $139 resistance zone.
However, the $96 level should be treated as an important structural reference rather than a guaranteed floor. A decisive break below this support could alter the current market structure and increase the probability of a rotation towards the next major support around $65.
For now, the primary focus remains on how price reacts around these two levels. Holding above $96 would preserve the existing bullish structure, while a sustained break below it would warrant reassessing the current market outlook and the strength of the prevailing trend.
-----------------------------------------------------------------------------------------------
Don't invest unless you're prepared to lose all the money you invest. This is a high-risk investment and you should not expect to be protected if something goes wrong. Take 2 mins to learn more: coinjar.com/uk/risk-summary
The article is an opinion expressed by the author at a point in time and does not represent the views of CoinJar UK Limited or CoinJar Australia Pty Ltd. Take care to consider the date of this article and be aware that this opinion is based on circumstances at the time of publishing. No responsibility or liability is accepted for any errors of fact or omission expressed therein. Past performance is not a reliable indicator of future results.
This above article is not to be read as investment, legal or tax advice and it takes no account of particular personal or market circumstances; all readers should seek independent investment advice before investing in cryptocurrencies.
We recommend you obtain financial advice before making a decision to use your credit card to purchase cryptoassets or to invest in cryptoassets.In the UK, it's legal to buy, hold, and trade crypto, however cryptocurrency is not regulated in the UK. It's vital to understand that once your money is in the crypto ecosystem, there are no rules to protect it, unlike with regular investments.
You should not expect to be protected if something goes wrong. So, if you make any crypto-related investments, you're unlikely to have recourse to the Financial Services Compensation Scheme (FSCS) or the Financial Ombudsman Service (FOS) if something goes wrong.
---------------------------------------------------------------------------------------------- WLD 8H – Rising Trendline Recovery Into Horizontal ResistanceWLD on the 8H timeframe is currently trading around 0.4086 after bouncing from the rising trendline near 0.2950–0.3100 in late July and recovering steadily, with price now pressing into the 0.4000–0.4200 horizontal resistance zone that has been a consistent pivot throughout the post-spike consolidation.
The chart shows a rising trendline originating from the late May low near 0.2220, connecting the June 8 low near 0.2530 and continuing to climb into the 0.3200–0.3250 area currently. Price spiked from that trendline in early June to a high near 0.7000 before collapsing sharply back through 0.5000, 0.4400, and 0.4200 in a near-complete retrace of the move. The post-spike decline eventually brought price back to the rising trendline near 0.2950–0.3100 in late July where it found support and the current recovery began. The horizontal level near 0.4000–0.4200 has been the most consistent pivot on this chart across the entire visible structure, acting as support before the spike, as resistance after the spike collapse, and now as the ceiling of the current recovery. Price has pushed from the trendline through 0.3200, 0.3600, and into the 0.4000–0.4200 zone where multiple prior recoveries have stalled.
The 0.4000–0.4200 zone has rejected every meaningful recovery attempt since the spike collapsed, making the current test the most watched level on the chart and the key determinant of whether the trendline bounce produces a sustained recovery or repeats the prior rejection pattern.
Key Levels To Watch
→ 0.6600–0.7000 Spike high, major resistance above
→ 0.5200–0.5400 Prior spike consolidation, resistance
→ 0.4400–0.4600 Mid-range resistance zone
→ 0.4000–0.4200 Horizontal pivot, current resistance test
→ 0.3600–0.3800 Minor support, prior recovery zone
→ 0.3200–0.3250 Rising trendline, dynamic support (climbing)
→ Below 0.2950 Trendline breakdown, macro structure at risk
A confirmed break above 0.4000–0.4200 and follow-through toward 0.4400–0.4600 would signal the first meaningful structural shift since the spike collapse, opening a recovery toward the mid-range zone and potentially 0.5200–0.5400 on continuation.
A rejection at 0.4000–0.4200 and a return toward the rising trendline near 0.3200–0.3250 would continue the pattern of failed recoveries at this level, and a confirmed close below the trendline would break the macro support floor that has held every low since May.
Trendline recovery pressing into the most tested resistance on this chart. Break above 0.4200 → first sustained recovery, eyes on 0.4400–0.5200. Reject here → prior pattern repeats, trendline near 0.3200 next. Bias cautiously bullish above rising trendline. Shift only on confirmed close below 0.3200–0.3250.  Long
Long
Short 
AMD - Up nearly 5%AMD shares rose nearly 5%, leading the semiconductor sector. The company announced the addition of UCIe interconnect technology to its Versal adaptive SoCs, enabling low-power, high-bandwidth chiplet communication. Raymond James upgraded the stock to "Strong Buy" and raised its price target to $641. Shipments of the rack-scale Helios AI platform are expected to begin in September.
Institutional investors are optimistic about AMD's progress in AI server CPUs and full-rack solutions, noting the stock's improved valuation appeal following a prior pullback. Analysts highlighted the doubling of data center revenue year-over-year and design wins with OpenAI, Meta, and others, suggesting that a multi-vendor landscape favors AMD's market share gains.
- Support levels:
+ Immediate support: $465 – $471
+ Strong support: $435 – $455, encompassing the psychological $455 mark and the 0.236 Fibonacci level near $435. This serves as a critical anchor for maintaining the medium-term uptrend.
- Resistance levels: Resistance refers to a price zone where selling pressure typically intensifies, making an immediate breakout difficult.
+ Short-term resistance: $492 – $496, corresponding to the 0.382 Fibonacci level and recent technical resistance points.
+ Strong overhead resistance: $511 – $580; the $511 mark represents the upper limit of the current sideways range, while the 52-week high sits near $584.73.
- Short-term trading:
+ Look to accumulate positions when the price pulls back to the $435–$450 support zone and shows signs of rebounding.
+ Stop-loss: Place below $425 to manage risk in case the bullish price structure breaks down.
+ Take-profit: Target the $492 resistance level, or aim higher for the $540 zone.
With Bitget Stock Perps, you can trade US stocks 24/7 on Bitget, enabling you to respond promptly to key events even outside traditional trading hours.


