BTCUSD: Inverse H-S-Formation to Determine Next Steps!Hello Community,
welcome to my new analysis of BTCUSD from a weekly time frame perspective. BTCUSD is forming some important developments after the huge bullish momentum, and volatility pushed into the higher spheres of the local price data. In this case, I have spotted pivotal developments which will determine the upcoming outcomes of BTCUSD and what the underlying formation is.
When looking at my chart, we can see how BTCUSD recently moved right into this 50-MA marked in blue and tested it with strong bullish momentum. The most important part of it is that BTCUSD already formed the first parts of an inverse head-shoulder formation. The left shoulder and the head have already been completed.
Next time, when BTCUSD pulls back from the 50-MA, as seen in my chart, this is likely to lead to the right shoulder forming from there on. BTCUSD has strong support within the ascending trendline, also matching the 200-MA. It is likely that BTCUSD will find support in these areas.
Once a bounce in these areas occurs and BTCUSD manages to break out above the neckline of the inverse head-shoulder formation, there is a strong potential for the targets seen in my chart to be activated. Such a price move will also be supported by a golden MA-cross with the 200-MA crossing the 50-MA to the upside.
In this manner, thank you a lot for watching!
The support is highly appreciated.
VP  Short
Short
 Long
Long
BTCUSDT Rejected at 81,400 — Correction Toward 78,000 in FocusHello traders! Here’s my technical outlook based on the current BTCUSDT (3H) chart structure. BTCUSDT previously traded inside a broad range before breaking above the resistance line and shifting bullish. Price then rallied strongly toward the 81,400 Seller Zone, where sellers rejected the upside twice. Currently, BTCUSDT is trading below the 81,400 Seller Zone while facing resistance near the recent highs. The repeated rejection suggests that a short-term bearish correction may develop toward the 78,000 Buyer Zone. As long as BTCUSDT remains below the 81,400 Seller Zone and fails to break above the recent highs, the bearish scenario remains valid. A rejection from current levels could push price toward the 78,000 Buyer Zone (TP1). However, a strong breakout and close above 81,400 would weaken the bearish outlook and increase the possibility of further upside. Please share this idea with your friends and click "Boost" 🚀  Short
Short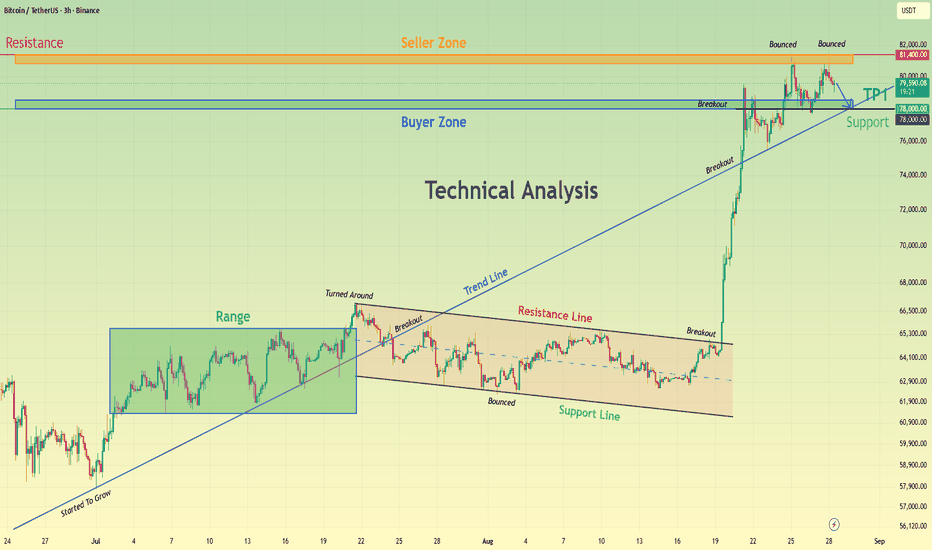
 Short
Short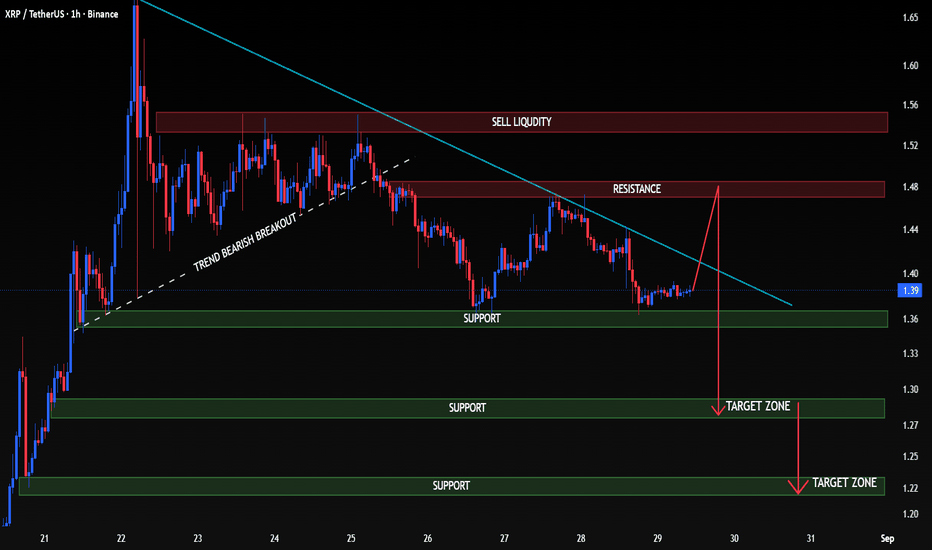
LINKUSDT - Hunting for liquidity before growthBINANCE:LINKUSDT.P is consolidating within the 11.00–12.00 range following a strong rally. However, corrections are typical within a consolidation phase, and the market could enter a liquidity-hunting phase before moving higher
Bitcoin has entered a consolidation phase after its strong rally. A correction could develop within this consolidation. Overall, the market still has bullish potential, and if the fundamental backdrop remains unchanged, the uptrend could resume soon.
The altcoin is consolidating after a strong rally. The key range is 11.00–12.00. A counter-trend correction is developing, and LINK could test the liquidity area before moving higher
Resistance levels: 12.00, 12.6
Support levels: 11.0, 10.90
Technically, a long squeeze of the 11.04–10.90 liquidity zone followed by consolidation above this area could shift the balance of power in favor of buyers and trigger a move toward the 11.60 area and the 12.02 liquidity zone
Best regards,
R. Linda.  Long
Long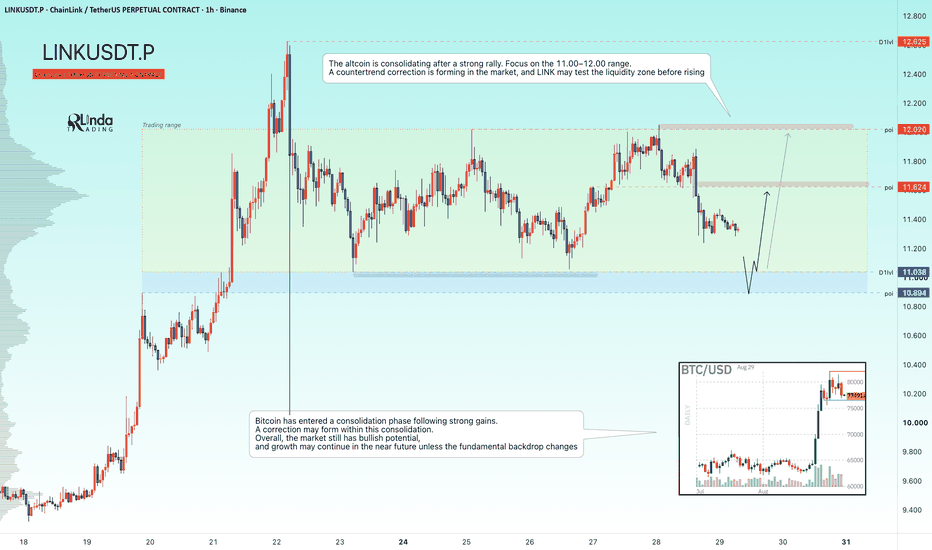
Bitcoin Breakdown Alert: Bearish Structure in Control📊 BTC/USD — 30M Chart Analysis
Bias: 🔴 Bearish
The chart is showing a clear liquidity sweep + structure breakdown setup.
🔻 Key Structure
BTC swept the previous highs around 81,000–81,500, taking buy-side liquidity.
After the sweep, price strongly rejected the 80,000–80,700 supply zone.
A bearish Change of Character (ChoCH) followed, confirming weakening structure.
Price is now trading around 77,700, below the recent swing structure.
🎯 Important Levels
Resistance / Supply: 80,000–80,700
Order Block: 77,300–77,600
Current area: ~77,700
Major Demand: 76,400–76,600
Potential downside target: 76,336
📉 Trade Idea
If BTC gets rejected from 77,300–77,700 and forms another bearish 30M candle, the continuation setup favors:
SELL → 77,300–77,700 rejection
SL → above 78,300
TP1 → 76,600
TP2 → 76,336
⚠️ If BTC reclaims 78,300 with a strong 30M close, the bearish setup becomes weaker and I'd avoid forcing the short.
Overall: The higher-probability setup shown by your chart is SELL on confirmation, targeting the 76.4K–76.6K demand zone. Short 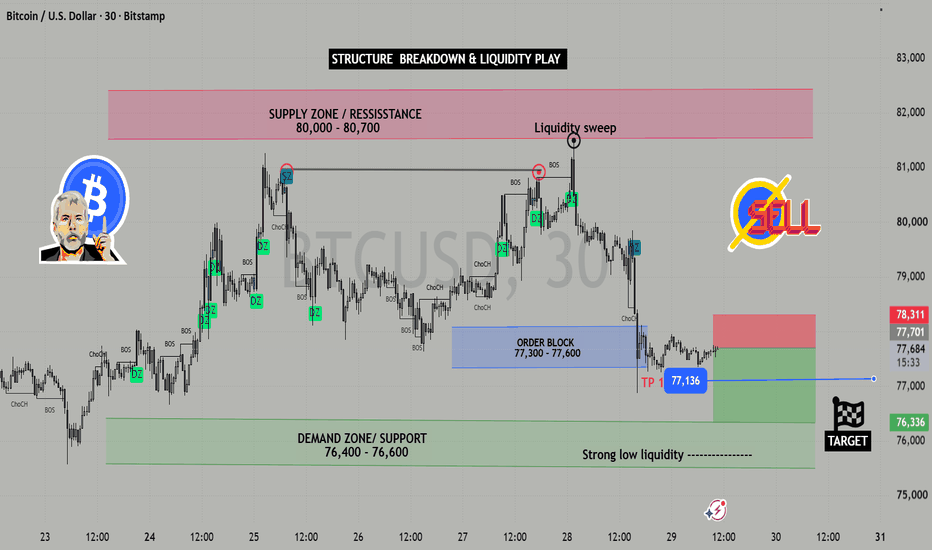
Ethereum at the breakout edge — the big move is loading!ETHUSD is maintaining a bullish higher-timeframe structure after the strong rally from the 1,900 area. The latest price action is forming a symmetrical triangle / compression pattern, with a descending upper trendline and ascending lower trendline. This suggests that price is approaching a potential volatility expansion and breakout.
📊 Key Levels
🔴 Resistance Zone: 2,550
Major resistance and the upper boundary of the consolidation.
A strong 1H close above 2,550 would confirm the bullish breakout.
🟢 Supporting Area: 2,380–2,400
Key short-term support and lower boundary of the triangle.
Holding this area keeps the bullish setup valid.
🟢 Demand Zone: ~2,300
Stronger downside demand if the current support fails.
🎯 Target: 2,650
Main bullish objective after a confirmed breakout above 2,550.
📈 Market Structure
CHOCH: The earlier bearish structure around 1,900 shifted into a bullish phase.
BOS: Strong bullish BOS occurred around 2,110 and again around 2,440, confirming the upward structure.
Current Pattern: Symmetrical triangle / compression
Higher Highs & Higher Lows: Overall structure remains bullish.
Supertrend: Around 2,470, currently slightly above price, so a reclaim of this level would add bullish confirmation.
🚀 Bullish Scenario
The key setup is a triangle breakout.
If ETH reclaims 2,470–2,500 and then breaks decisively above 2,550, bullish momentum could accelerate toward:
2,550 → 2,600 → 2,650
The cleaner approach is to wait for breakout confirmation or a successful retest of 2,550 rather than entering directly underneath resistance.
⚠️ Bearish Risk
If the ascending trendline breaks and ETH loses 2,380, the bullish triangle setup weakens.
A deeper move below 2,300 would invalidate the immediate bullish continuation idea and could signal a larger correction.
🔥 Overall Bias
🟢 BULLISH — WAITING FOR TRIANGLE BREAKOUT
Key Battle: 2,550 resistance vs. 2,380–2,400 support
Breakout Target: 2,650
Best Setup: Bullish breakout + retest / buy confirmed pullback  Long
Long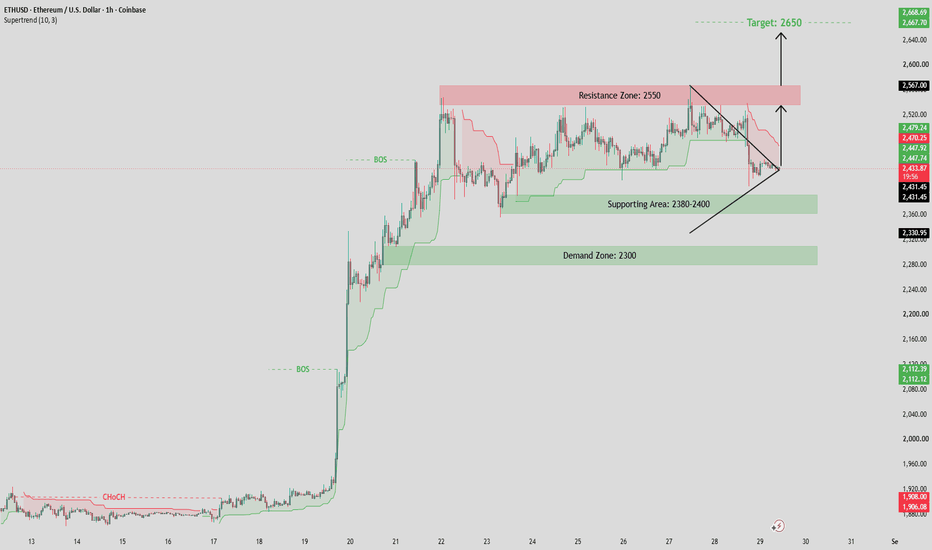
BTCUSD 2-Hour Technical SetupCurrent Market Structure: Price is consolidating near 77,698, holding above a local reaction zone after a pullback from the upper trendline resistance.
Key Support Zone: 75,000 – 76,000, reinforced by a rising trendline and previous reaction lows marked with blue arrows.
Key Resistance / Target Zone: 84,000 – 85,000, aligning with the overarching supply region indicated at the top of the chart.
Path to Target: Anticipating a continuation bounce from current levels or a slight retest of the lower ascending support trendline near 77,000, followed by an impulsive drive upward through intermediate resistance levels toward the 84,000 target.
Risk Management: Maintain strict risk parameters; place stop-loss orders below the ascending support trendline / 75,000 support zone to invalidate the setup upon a structural breakdown.
Disclaimer: This analysis is published for educational and informational purposes only and does not constitute financial advice. Trade at your own risk Long 
Short 
Short 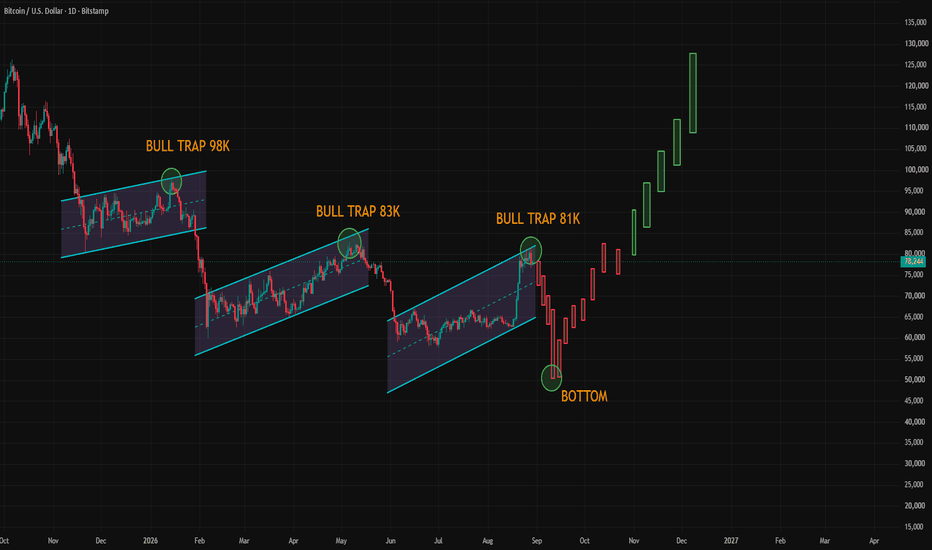
Short 
Short 
BTC 1H: Will the Buy Zone Hold After This Drop?Bitcoin just gave traders a textbook Smart Money Concepts (SMC) setup on the 1-hour chart, and it's worth breaking down for anyone learning how price structure works.
From August 21, BTC climbed steadily from around 76,850 to a high of 81,499, printing several BOS (Break of Structure) signals along the way — each one confirming the uptrend was still in control. Buyers kept pushing higher until price finally exhausted near the top, leaving behind an unfilled FVG (Fair Value Gap) around the 80,300 area. Think of an FVG as a "gap" in trading activity that price often likes to revisit later.
After the high, momentum flipped. Price broke down through the 0.5 (79,175) and 0.618 (78,626) Fibonacci levels, confirming a CHoCH (Change of Character) — the first real sign that sellers had taken control from buyers.
Now price is dropping into a key Buy Zone, sitting right between the 76,851 swing low and the 0.618 fib level (78,626). This is a classic SMC demand zone: an area where institutional buyers may have left unfilled orders during the original rally. The projected path (blue arrows) suggests a possible reaction here — a bounce, a retest, then a push back up toward the 78,600–79,000 Fibo Zone.
But nothing is guaranteed. If price closes decisively below 76,851, the bullish structure breaks down completely, and that would flip the bias bearish.
For beginners: the key takeaway is that SMC isn't about predicting the future — it's about reading where smart money likely left orders, and reacting only when price confirms it (like a bullish CHoCH on a lower timeframe inside the zone).
💬 What's your take — do you think BTC bounces from this Buy Zone, or breaks below 76,851 first? Long 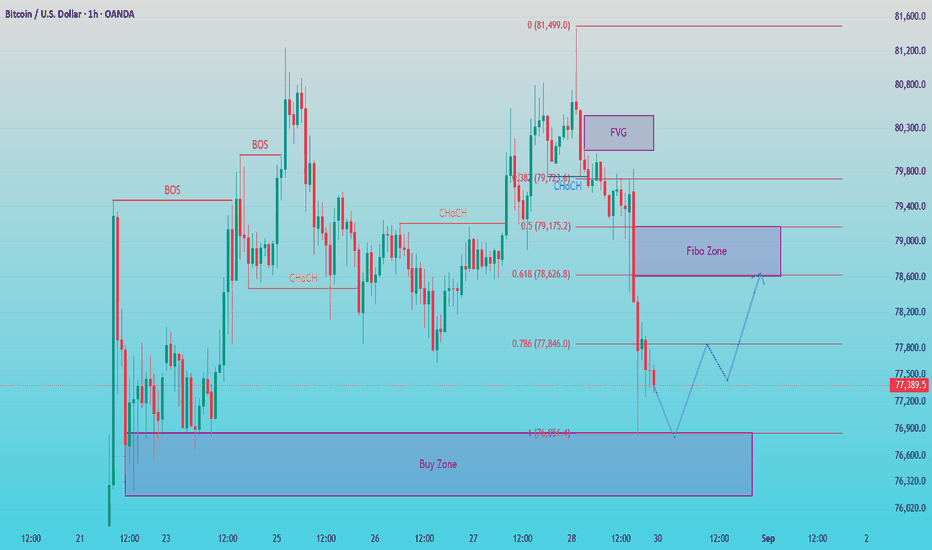
ETHUSD — 1H Market AnalysisETHUSD is currently consolidating after a strong bullish expansion from the lower levels. Price is now trading inside a contracting triangle pattern, showing decreasing volatility as the market approaches a potential decision point.
🔍 Market Structure
The broader move remains strongly bullish, but the recent price action is forming lower highs against rising support. This creates a triangle structure where a confirmed breakout could provide the next directional clue.
📈 Bullish Scenario
A sustained breakout and acceptance above the upper trendline could indicate renewed bullish momentum. In that case, price may revisit the recent highs around the 2,520–2,560 area.
📉 Bearish Scenario
If price loses the ascending trendline support and confirms a breakdown below the triangle, the current bullish momentum may weaken. The next major area of interest would be the highlighted Golden Fibonacci Zone around 2,160–2,220, where price could potentially look for a reaction.
🎯 Key Areas to Watch
Triangle resistance: around 2,500–2,520
Triangle support: around 2,400–2,420
Recent swing high: around 2,520–2,560
Golden Fibonacci Zone: around 2,160–2,220
📌 Overall Outlook
ETHUSD is currently at a key consolidation phase. Rather than anticipating the direction, the focus remains on price confirmation outside the triangle. A bullish breakout could support continuation toward recent highs, while a bearish breakdown may open the possibility of a deeper retracement toward the Golden Fibonacci Zone.
This analysis is shared for educational purposes and reflects a technical perspective only. Always use proper risk management and wait for your own confirmation before making any trading decision. Short 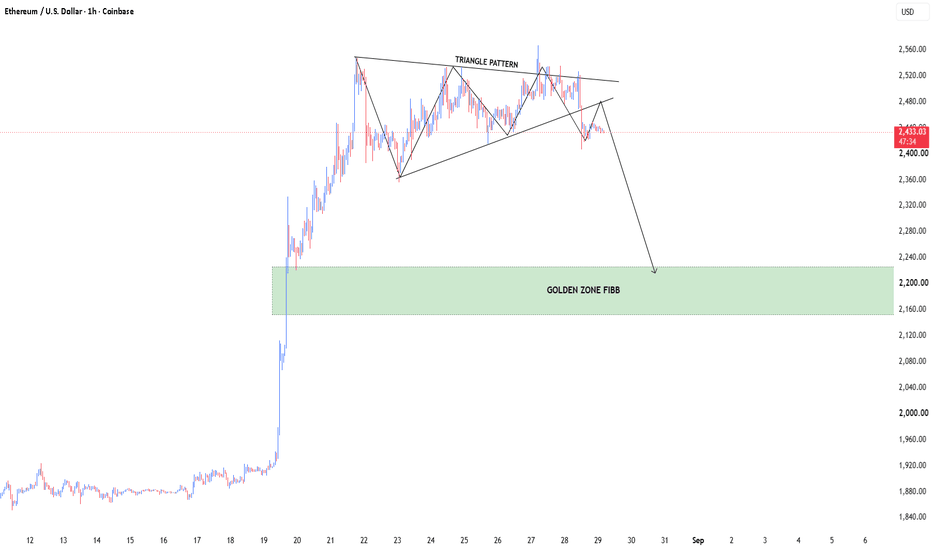
Short 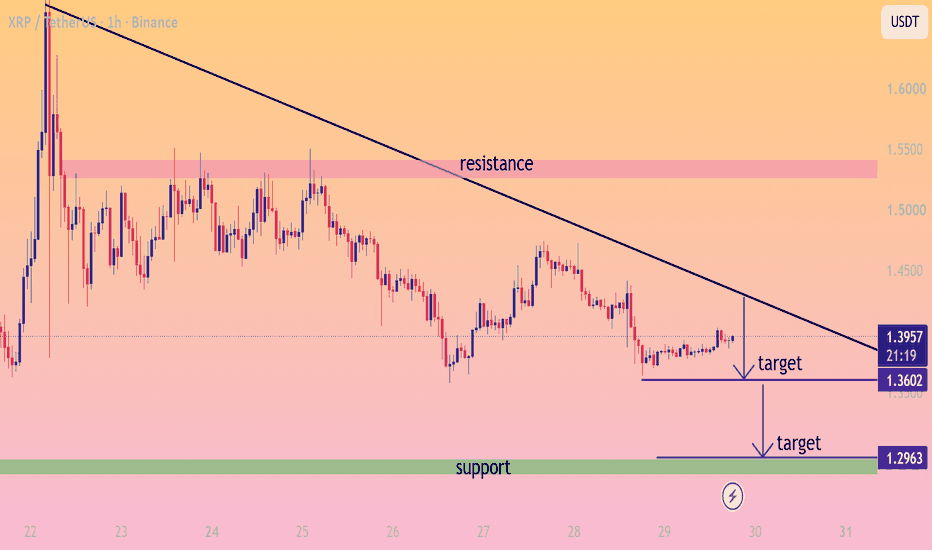
Short 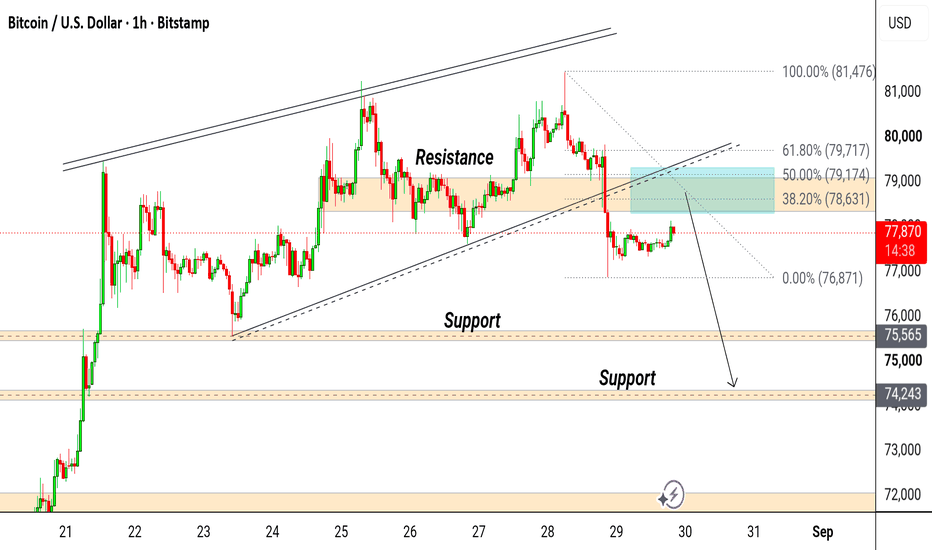
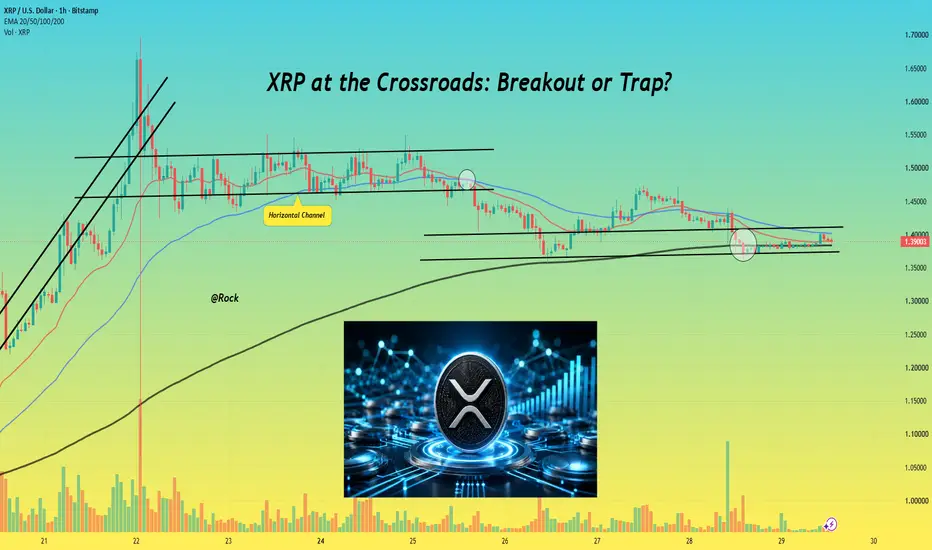
XRP at the Crossroads: Breakout or Trap?🚀 Hey! Hope everyone is doing well, here with a quick beyond, technical analysis here on price action, I'll keep this idea short and quick, make the most of today and enjoy the weekend!
🪙 Current Snapshot: XRP trades around $1.39 today, navigating volatile 24 hours with $1.76 billion trading volume.
📈 Macro Trend: Price recovered from $1.00 psych floor to recent peak near $1.70. Slight pullback feels like healthy profit-taking instead of structural breakdown.
🟢 Immediate Support: Key line in sand sits at $1.40 to $1.36 zone. Holding this level keeps bullish recovery structure intact.
🔴 Key Resistance: Heavy sell walls and whale distribution block path between $1.45 and $1.51. Daily candle close above $1.51 triggers next leg toward $1.60+.
📊 Technical Indicators: Moving averages lean toward buy sentiment, but 14-day RSI cooled into neutral territory around 41 to 46. Asset sits neither overbought nor oversold, leaving room for big move.
⚠️ Derivatives & Leverage: Watch out for leverage squeeze. Recent derivative selling pressure on major exchanges flushed out weak-hand long positions.
💡 Institutional Tailwinds: Narrative stays strong with massive spot product inflows hitting $1.66 billion recently. Rumors suggest traditional brokers expand custody options.
⚖️ Statutory Commodity Classification: Proposed CLARITY Act classifies XRP as digital commodity under CFTC oversight. Passing solidifies court victory and removes lingering regulatory ambiguity for conservative capital.
🏛️ September 15 Cloture Vote: Markets watch Washington for upcoming Senate cloture vote. Polymarket odds anchor advancement chance at 20% to 24%, meaning delay is largely priced in.
🚀 Best-Case Scenario ($2.00+): Passing bill triggers massive institutional supply squeeze. Successful vote shatters local resistance and rockets price toward $2.00 mark by late September.
📉 Stalling Risk ($1.00 Fallback): Failure or delay past midterms dents market confidence. Without legislative backing, asset relies on judicial precedents and risks breaking down to $1.00 support level.
🏦 Banking Unlock: Passing vote gives traditional banks concrete legal framework to hold and settle transactions. Financial networks can confidently scale on-chain cross-border settlements using XRP Ledger. This basically gives XRP a much firmer, secure position/ability to scale up it's utility and influence to real institutions with real support and again, framework.
Have to go but really appreciate everyone for joining me as always, may this find you well and let's keep fighting for the future we deserve.
Best regards,
~ Rock ' Bitcoin – Possible Bearish ScenarioBTC is currently trading around $78,000 after a strong recovery from the recent lows. However, the price structure still shows signs of weakness after the previous major high.
The red line represents my personal projected price path, not a confirmed market movement. In this scenario, Bitcoin could face resistance around the $80K–$85K area, form another lower high, and then move toward the $63K–$65K support zone.
If this support fails, the next major levels I’m watching are around $55K and potentially $41.5K.
The RSI is recovering, but momentum is not yet strong enough to confirm a full bullish reversal. For now, I’m watching how BTC reacts at the key resistance and support levels.
This is my personal technical analysis, not financial advice. Short 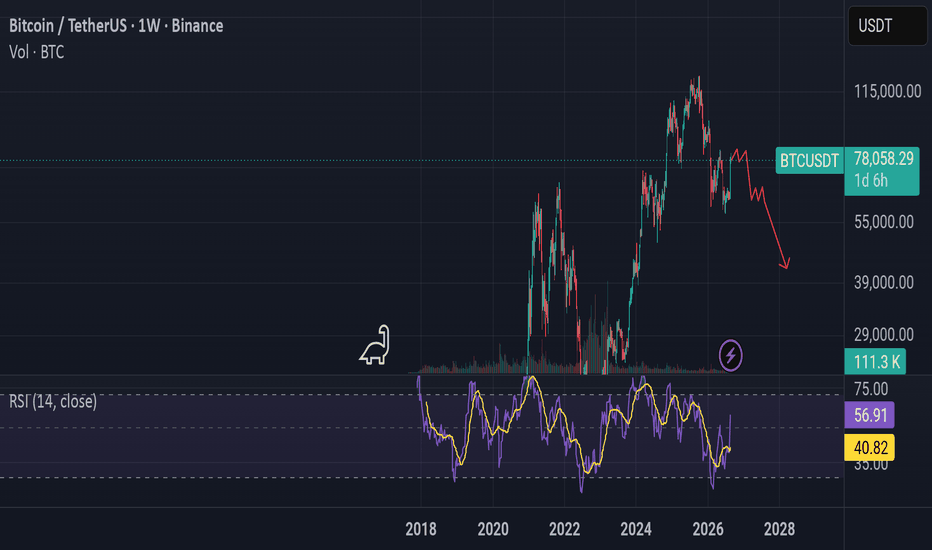
 Long
Long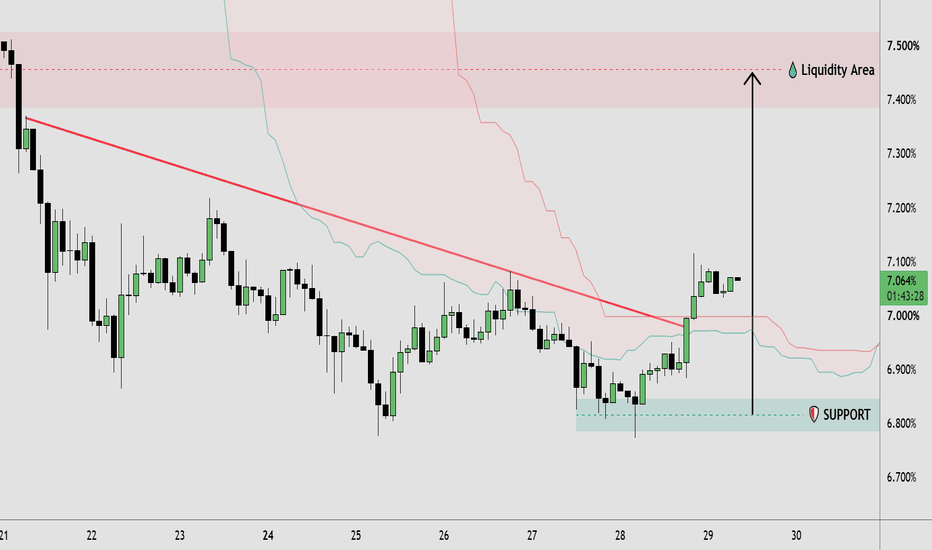
Short 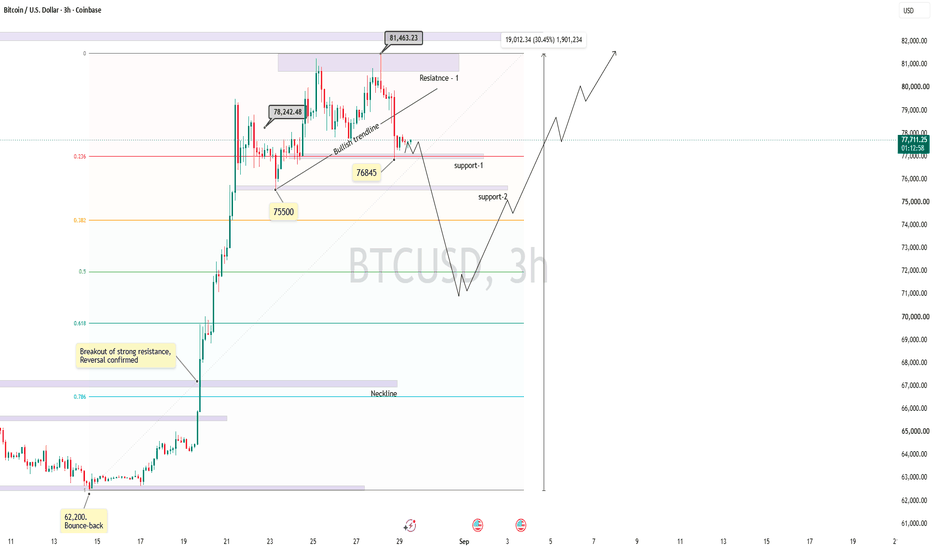
 Long
Long