Silver’s rebound fades as downside risks growSilver prices have fallen sharply, giving back much of their recent gains after failing to push through resistance near $71. Silver now finds itself close to a support region around $63 to $64. A break below that area could be a problem for the metal and may result in prices declining further, perhaps back towards the mid-$50s.
Silver recently broke an uptrend on the price chart on 31 August, with that trend having been established at the end of July. In addition, the relative strength index had also formed an uptrend, which has now been broken as well. The break in both price and momentum suggests that the bullish move seen in August may be fading, with the trend potentially shifting from bullish to bearish.
Silver price, July 2026 – present
Source: TradingView, 2 September 2026
Dollar strength has also contributed to silver’s recent weakness. Heading into the end of 2025, silver and the dollar were moving together, but that relationship shifted back to its more typical inverse pattern at the start of 2026. Continued dollar strength could therefore put additional pressure on silver.
Silver and US dollar index, December 2025 – present
Source: TradingView, 2 September 2026
The drivers of that dollar strength will be worth watching. A dollar rally accompanied by higher interest rates and rising real yields, rather than rising inflation expectations, could create a more challenging backdrop for silver.
Silver, interest rates and real yields, December 2025 – present
Source: TradingView, 2 September 2026
Written by Michael J. Kramer, founder of Mott Capital Management.
Disclaimer: CMC Markets is an execution-only service provider. The material (whether or not it states any opinions) is for general information purposes only and does not take into account your personal circumstances or objectives. Nothing in this material is (or should be considered to be) financial, investment or other advice on which reliance should be placed.
No opinion given in the material constitutes a recommendation by CMC Markets or the author that any particular investment, security, transaction, or investment strategy is suitable for any specific person. The material has not been prepared in accordance with legal requirements designed to promote the independence of investment research. Although we are not specifically prevented from dealing before providing this material, we do not seek to take advantage of the material prior to its dissemination. Brent oil may be positioned to surge above $100Conditions in the Middle East remain volatile, and Brent crude oil now appears poised to move sharply higher after a period of consolidation. Brent already broke out of a bull flag pattern in mid-August and has been trending higher. It now appears to have formed a symmetrical triangle, which in this case could act as a bullish continuation pattern.
The pattern has been formed by a series of higher lows and lower highs. Currently, a move above $95.50 would be enough for Brent to clear the downtrend and move beyond the previous lower high from 21 August. If that happens, Brent could be on a path to higher prices.
At present, the technical chart suggests that Brent could rise back towards $100, the high established on 23 July. However, the technical pattern also suggests there could be further room to rise if Brent reaches $100. A projection of the move from the low established on 6 July to the high on 23 July, measured from the low on 26 August, would suggest Brent could rise towards $117, bringing it back towards the highs seen in early May.
If the price fails to break out and instead breaks down through the lower boundary of the symmetrical triangle at around $90, that would be bearish and could lead to a return to the August lows near $82.
Written by Michael J. Kramer, founder of Mott Capital Management.
Disclaimer: CMC Markets is an execution-only service provider. The material (whether or not it states any opinions) is for general information purposes only and does not take into account your personal circumstances or objectives. Nothing in this material is (or should be considered to be) financial, investment or other advice on which reliance should be placed.
No opinion given in the material constitutes a recommendation by CMC Markets or the author that any particular investment, security, transaction, or investment strategy is suitable for any specific person. The material has not been prepared in accordance with legal requirements designed to promote the independence of investment research. Although we are not specifically prevented from dealing before providing this material, we do not seek to take advantage of the material prior to its dissemination. USD/CAD could be ready to reboundUSD/CAD may be set to rise after reaching oversold conditions, while the US-Canada trade dispute has started to heat up again. The US dollar has weakened against the Canadian dollar since the beginning of July, but with USD/CAD now trading below its lower Bollinger Band and the relative strength index below 30, the pair appears due for a potential rebound.
A rise in USD/CAD would mean the US dollar is gaining strength against the Canadian dollar. The first test for the pair is likely to be the 10-day exponential moving average, which sits around $1.3850. If USD/CAD can break above that resistance level, it may have room to rise further, potentially towards the 20-day simple moving average and the midpoint of the Bollinger Bands around $1.3940.
Another bullish indication for the US dollar is that the relative strength index has moved above the downtrend that began in early July. This could signal that a reversal is underway and that momentum in USD/CAD is shifting from bearish to bullish.
If USD/CAD fails to break out and move above the 10-day exponential moving average, it is likely to find support near the lower Bollinger Band around $1.3750.
Written by Michael J. Kramer, founder of Mott Capital Management.
Disclaimer: CMC Markets is an execution-only service provider. The material (whether or not it states any opinions) is for general information purposes only and does not take into account your personal circumstances or objectives. Nothing in this material is (or should be considered to be) financial, investment or other advice on which reliance should be placed.
No opinion given in the material constitutes a recommendation by CMC Markets or the author that any particular investment, security, transaction, or investment strategy is suitable for any specific person. The material has not been prepared in accordance with legal requirements designed to promote the independence of investment research. Although we are not specifically prevented from dealing before providing this material, we do not seek to take advantage of the material prior to its dissemination. The EUR/USD may be close to breaking outEUR/USD is approaching a key resistance zone that could extend its recent rally if the pair manages to break higher. The exchange rate is currently trading above its 200-day moving average, which could prove significant and may point to further euro strength if EUR/USD clears resistance around $1.1660. A confirmed breakout could open the way for a move towards the $1.1790 to $1.1820 range.
However, EUR/USD is also approaching overbought territory, suggesting that the rally could pause before extending further. The relative strength index is currently around 70, while the pair is closing in on the upper Bollinger Band near $1.1660. This means that any further gains may increase the risk of a pullback, either to retest the breakout level or to enter a period of sideways consolidation.
If the breakout attempt fails and EUR/USD falls back below $1.1600, the risk of a deeper pullback would increase. In that scenario, the pair could test support near the bottom of its previous consolidation range around $1.1520. A break below that level would point to a more severe decline, potentially back towards $1.1370. For now, however, the bulls appear to be taking control.
Written by Michael J. Kramer, founder of Mott Capital Management.
Disclaimer: CMC Markets is an execution-only service provider. The material (whether or not it states any opinions) is for general information purposes only and does not take into account your personal circumstances or objectives. Nothing in this material is (or should be considered to be) financial, investment or other advice on which reliance should be placed.
No opinion given in the material constitutes a recommendation by CMC Markets or the author that any particular investment, security, transaction, or investment strategy is suitable for any specific person. The material has not been prepared in accordance with legal requirements designed to promote the independence of investment research. Although we are not specifically prevented from dealing before providing this material, we do not seek to take advantage of the material prior to its dissemination. USD/JPY tests critical support after latest interventionUSD/JPY has seen another round of intervention, pushing the pair down to $156.70 after climbing to nearly $164.
The latest move has pushed the exchange rate back to a familiar area around $155. That was the level last tested, but not broken, during the previous round of intervention in April, and that remains the case after the latest intervention.
The $155 level was tested several times during the spring and held firm. It was one reason the previous round of intervention failed to generate meaningful follow-through, ultimately allowing USD/JPY to resume its upward trend.
At this point, USD/JPY is technically oversold, with the relative strength index below 30 and the exchange rate trading below its lower Bollinger Band.
This is not a purely technical situation, and traditional technical analysis may not fully apply. Even so, assuming there is no further intervention, the currency pair could be due for a rebound.
If the exchange rate breaks below $155, there is scope for it to fall further, potentially finding support around $152.50.
However, if support at $155 holds and USD/JPY fails to break below that level, the pair could climb back towards $160, retracing much of the losses seen during the latest round of intervention. Silver's next big move may be lowerSilver prices have continued to trade sideways over the past several weeks. At this point, we are also seeing implied volatility, as measured by the CBOE Silver ETF Volatility Index (VXSLV), begin to decline again.
This is likely because realised volatility, measured over the past 21 days, has also fallen. This suggests that silver's implied volatility is likely to continue to decline.
Silver prices have largely risen alongside implied volatility, reflecting increased risk-taking and speculative activity in the options market.
As implied volatility falls, silver prices may continue to drift lower over time.
Currently, silver remains at an important inflexion point around the $57-$58 region. While it has not yet broken below support, the descending triangle pattern continues to develop.
In addition, silver attempted to break above the downtrend but failed to hold the move. It has also fallen back below the 10-day exponential moving average after failing at that level late last week.
If silver breaks below the $54 support level, the next major area of support is around $49.50. Conversely, if it can reclaim the $60 level, there is room for a move towards $67-$68.
However, given the current market backdrop of rising interest rates, a stronger US dollar and higher real yields, that upside potential appears somewhat limited.
Written by Michael J. Kramer, founder of Mott Capital Management.
Disclaimer: CMC Markets is an execution-only service provider. The material (whether or not it states any opinions) is for general information purposes only and does not take into account your personal circumstances or objectives. Nothing in this material is (or should be considered to be) financial, investment or other advice on which reliance should be placed.
No opinion given in the material constitutes a recommendation by CMC Markets or the author that any particular investment, security, transaction, or investment strategy is suitable for any specific person. The material has not been prepared in accordance with legal requirements designed to promote the independence of investment research. Although we are not specifically prevented from dealing before providing this material, we do not seek to take advantage of the material prior to its dissemination. Gold faces critical breakout testGold has been in a downtrend since peaking in early March, testing the trendline several times in mid-May and early June but failing to produce a breakout. It is now approaching the trendline again, with resistance around $4,130.
A breakout above $4,130 would be a positive development and could pave the way for a move back towards $4,400.
Moving averages leave more to prove
Gold is still consolidating and has only recently moved slightly above both its 10-day exponential moving average and 20-day simple moving average. The 50-day simple moving average sits just ahead at around $4,250.
The trendline has been tested several times, but so far it has failed to produce a meaningful breakout. That keeps the current move in a testing phase rather than confirming a full technical shift.
Gold continues to hold support around $4,000, although the broader technical picture still resembles a descending triangle, a bearish technical pattern.
Fundamentals are also working against gold, with rising real yields and a strengthening US dollar potentially acting as a headwind for precious and industrial metals.
Momentum is showing some improvement, with the relative strength index breaking above its own downtrend. That suggests momentum may be starting to shift.
If gold were to break above $4,200, it would likely confirm a cleaner breakout and open the way for a move towards $4,400, with scope for further gains beyond that. For now, however, there is still much to be proven.
Written by Michael J. Kramer, founder of Mott Capital Management.
Disclaimer: CMC Markets is an execution-only service provider. The material (whether or not it states any opinions) is for general information purposes only and does not take into account your personal circumstances or objectives. Nothing in this material is (or should be considered to be) financial, investment or other advice on which reliance should be placed.
No opinion given in the material constitutes a recommendation by CMC Markets or the author that any particular investment, security, transaction, or investment strategy is suitable for any specific person. The material has not been prepared in accordance with legal requirements designed to promote the independence of investment research. Although we are not specifically prevented from dealing before providing this material, we do not seek to take advantage of the material prior to its dissemination. Silver may still be heading much lowerSilver has now broken below the key support level around $58.50, reinforcing the bearish technical outlook. Following yesterday's sharp decline, the next major area of support appears to be around $49.50 if selling pressure continues.
The breakdown also strengthens what appears to be a descending triangle, a pattern that is typically considered bearish.
Unless silver can reclaim the former support area around $58.50 and move back above the 10-day exponential moving average near $59.50, followed by the 20-day moving average around $61, the technical picture continues to favour further downside.
A recovery above those resistance levels could pave the way for a rally towards $67.50. However, momentum remains weak, with the relative strength index (RSI) continuing to suggest that silver is vulnerable to making fresh lows.
The US dollar also remains an important factor. Although softer-than-expected US consumer price index (CPI) and producer price index (PPI) data have weighed on the dollar this week, the decline has been relatively modest. If the US Dollar Index resumes its broader uptrend, it would likely create an additional headwind for silver.
Recent price action suggests that easing inflation expectations alone have not been enough to support precious metals, with silver recording its lowest close since December following yesterday's sell-off.
Written by Michael J. Kramer, founder of Mott Capital Management.
Disclaimer: CMC Markets is an execution-only service provider. The material (whether or not it states any opinions) is for general information purposes only and does not take into account your personal circumstances or objectives. Nothing in this material is (or should be considered to be) financial, investment or other advice on which reliance should be placed.
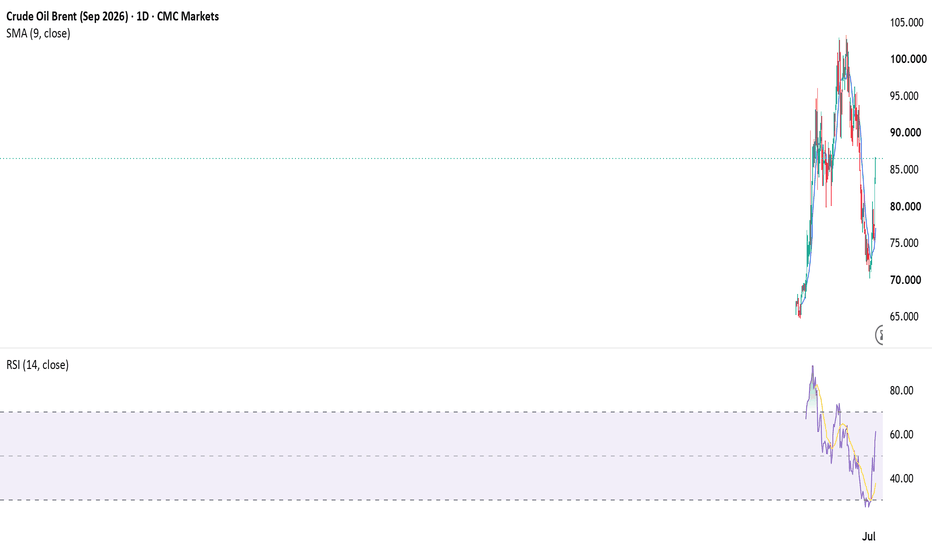
No opinion given in the material constitutes a recommendation by CMC Markets or the author that any particular investment, security, transaction, or investment strategy is suitable for any specific person. The material has not been prepared in accordance with legal requirements designed to promote the independence of investment research. Although we are not specifically prevented from dealing before providing this material, we do not seek to take advantage of the material prior to its dissemination. Brent oil extends rebound after holding key supportBrent crude oil prices recently fell back towards the support area around $70 per barrel, filling the gap that had remained open since 2 March. That support zone has held, and the market has since rebounded sharply.
The move has become more forceful since the TradingView chart was captured on 13 July, with Brent extending into the mid-$80s as renewed Middle East tensions add a fresh geopolitical risk premium to energy markets. That shift means the setup is no longer simply about whether Brent can recover from support; the immediate question is now whether the rebound can hold above the first major resistance area.
From a technical perspective, the recent rebound has improved the short-term picture. Brent has moved back above its 20-day moving average, while the relative strength index has broken above the downtrend that had been in place after the market reached oversold territory, below 30, from late June into early July.
The 10-day moving average is also close to crossing above the 20-day moving average. If that crossover is confirmed, it would provide another indication that short-term bullish momentum is strengthening and that the recent recovery is becoming more than a routine bounce from oversold conditions.
The first important upside level remains the area around $82.50, where prices consolidated between 16 and 22 June. Brent has now moved back into and above that zone, so the level may become a key reference point for whether the breakout can be sustained.
If Brent can hold above $82.50, attention is likely to shift towards the lower end of the next resistance zone, around $85.50, and then towards the 50-day moving average. That average sits inside a broader resistance band extending towards roughly $94 per barrel. A sustained move through that region would make the technical recovery look significantly stronger.
The bullish case still depends on whether the market can sustain the momentum that appears to be building. A failure to hold above the former $82.50 resistance area would weaken the near-term breakout signal and could leave Brent vulnerable to a pullback towards the short-term moving averages.
Below that, the key support area remains around $70.50. This level dates back to late January 2026 and held firmly until the end of February. A decisive break below $70.50 would therefore signal that the recent rebound had failed and could open the door to a much steeper decline.
Written by Michael J. Kramer, founder of Mott Capital Management.
Disclaimer: CMC Markets is an execution-only service provider. The material (whether or not it states any opinions) is for general information purposes only and does not take into account your personal circumstances or objectives. Nothing in this material is (or should be considered to be) financial, investment or other advice on which reliance should be placed.
No opinion given in the material constitutes a recommendation by CMC Markets or the author that any particular investment, security, transaction, or investment strategy is suitable for any specific person. The material has not been prepared in accordance with legal requirements designed to promote the independence of investment research. Although we are not specifically prevented from dealing before providing this material, we do not seek to take advantage of the material prior to its dissemination. U
Gold faces risk of a sharp breakdownGold prices have come under pressure as oil prices and bond yields rise, while the US dollar continues to strengthen. Although gold is often considered a safe-haven asset, that has not been the case since March, when tensions in the Middle East began to escalate. Instead, gold has instead traded like a risk asset, and that dynamic may well continue.
Gold has been in a major downtrend since mid-May and has failed to advance beyond its 20-day moving average on several occasions. Since mid-June, gold has been finding support in the $3,950 to $4,050 region, which, when combined with the prevailing downtrend, appears to be forming a descending triangle. These are typically considered bearish continuation patterns, and once the period of consolidation ends, gold may break below support and continue lower. If the region between $3,950 and $4,050 breaks, the next area of technical support appears to be around $3,650.
Additionally, momentum in gold remains bearish. The relative strength index has been trending lower and has been unable to move above 47. Each time it has reached that level, it has failed to see follow-through, suggesting that the momentum trend has not changed. Unless the relative strength index moves above 50, any visual change in the price trend would remain unconfirmed.
USD/JPY breakout points to highest levels in four decadesUSD/JPY has climbed to its highest level in nearly four decades, although the risk of intervention by the Bank of Japan continues to increase. The FX pair has moved above the highs last seen in July 2024 and is now approaching its next technical resistance level at around 164.50. It is currently trading near 162.30.
The weekly chart shows this most clearly, with previous resistance level around 161.95, the high reached during the week of 1 July 2024. Now that USD/JPY has moved above that level, the weekly chart suggests the next area of resistance comes in around 164.50, a level last seen in November 1986 before the yen entered a prolonged period of appreciation against the dollar.
The weekly chart also shows the relative strength index at around 65.40, and it has been trending higher, indicating that momentum in USD/JPY remains bullish. With the relative strength index (RSI) still below 70, there may be scope for further gains.
The weekly chart also appears to show an ascending triangle in USD/JPY and, perhaps more importantly, an inverse head-and-shoulders pattern. Both patterns suggest that a long-term breakout could happen soon, which could ultimately weaken the yen significantly and push USD/JPY towards 180 or even 200
Written by Michael J. Kramer, founder of Mott Capital Management.
Disclaimer: CMC Markets is an execution-only service provider. The material (whether or not it states any opinions) is for general information purposes only and does not take into account your personal circumstances or objectives. Nothing in this material is (or should be considered to be) financial, investment or other advice on which reliance should be placed.
No opinion given in the material constitutes a recommendation by CMC Markets or the author that any particular investment, security, transaction, or investment strategy is suitable for any specific person. The material has not been prepared in accordance with legal requirements designed to promote the independence of investment research. Although we are not specifically prevented from dealing before providing this material, we do not seek to take advantage of the material prior to its dissemination. EUR/USD faces a critical test before US jobs reportThe EUR/USD finds itself in a precarious position one day ahead of the key June US jobs report on Thursday, 2 July. Currently, EUR/USD is trading around 1.14, which is a key level of support. Additionally, we have seen a key level of resistance emerge at the 10-day exponential moving average.
Meanwhile, support for the euro appears fairly limited at this point. In fact, the euro is trading below the 50- and 200-day moving averages, suggesting they are now more likely to act as resistance than support.
If the euro breaks below the 1.1400 level following what could be a strong US jobs report, it is likely to weaken towards 1.1280. Over time, that could even lead to a further decline towards the 1.1090 area.
It is worth noting that the euro may be forming a bullish divergence, with the RSI making a higher low as recently as 24 June, while the exchange rate has made a lower low since mid-March. That could be the first sign that the euro is forming a bottom. However, it does not necessarily mean that the euro’s decline is over.
At this point, broad-based dollar strength appears to be developing across markets, which could become a significant headwind for the euro going forward.
Written by Michael J. Kramer, founder of Mott Capital Management.
Disclaimer: CMC Markets is an execution-only service provider. The material (whether or not it states any opinions) is for general information purposes only and does not take into account your personal circumstances or objectives. Nothing in this material is (or should be considered to be) financial, investment or other advice on which reliance should be placed.
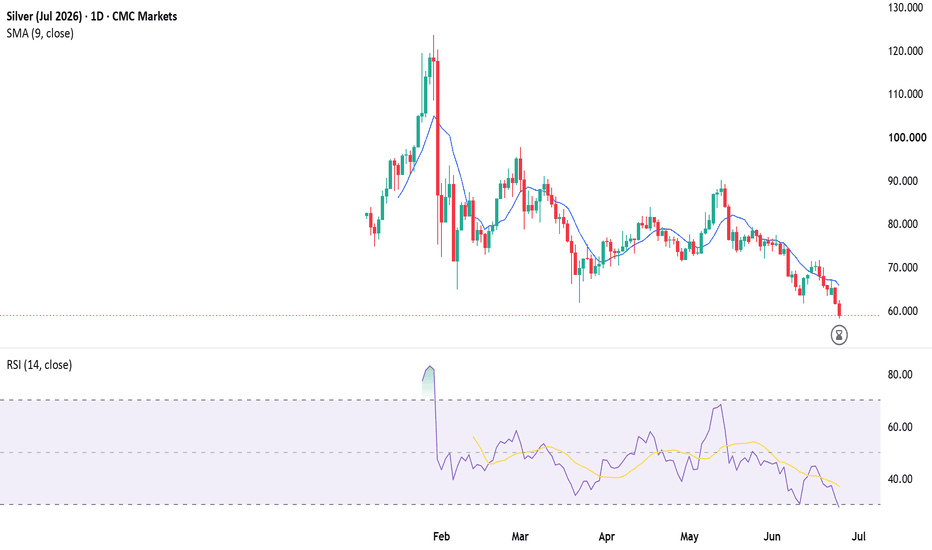
No opinion given in the material constitutes a recommendation by CMC Markets or the author that any particular investment, security, transaction, or investment strategy is suitable for any specific person. The material has not been prepared in accordance with legal requirements designed to promote the independence of investment research. Although we are not specifically prevented from dealing before providing this material, we do not seek to take advantage of the material prior to its dissemination. Silver prices may continue to fall amid a strong dollarSilver prices have continued to decline throughout June. The move appears to be accelerating to the downside as the dollar continues to strengthen. The dollar’s recent surge has been driven by the Federal Reserve’s hawkish stance at its June policy meeting, reflected in the dot plots' hawkish tilt and the absence of forward guidance, as well as the hawkish tone at the press conference delivered by new Fed Chair Kevin Warsh.
As a result, silver has continued its decline through the second half of June and is already trading below $59.50. This comes as silver appears to be reaching oversold conditions once again, similar to those seen in mid-June, when the price fell below the lower Bollinger Band, and the RSI dropped below 30.
These conditions could provide an opportunity for silver to consolidate sideways while also creating the potential for a rebound towards the 20-day moving average, similar to the move seen between 11 June and 17 June. However, the broader downward bias in silver may not yet be complete, particularly if the dollar continues to strengthen through the latter half of 2026.
A break of support at $59.50 could mean that silver falls even further, perhaps all the way back to around $49.
Written by Michael J. Kramer, founder of Mott Capital Management.
Disclaimer: CMC Markets is an execution-only service provider. The material (whether or not it states any opinions) is for general information purposes only and does not take into account your personal circumstances or objectives. Nothing in this material is (or should be considered to be) financial, investment or other advice on which reliance should be placed.
No opinion given in the material constitutes a recommendation by CMC Markets or the author that any particular investment, security, transaction, or investment strategy is suitable for any specific person. The material has not been prepared in accordance with legal requirements designed to promote the independence of investment research. Although we are not specifically prevented from dealing before providing this material, we do not seek to take advantage of the material prior to its dissemination. S
USD/JPY tests July 2024 high amid diverging rate expectationsEven after the Bank of Japan raised interest rates by 25 basis points during the week ending 19 June, USD/JPY has continued to rise, indicating that the Japanese yen remains under pressure against the US dollar. The move reflects the market’s view that the Bank of Japan is unlikely to deliver many more rate hikes, with only around a 70% chance of one additional increase being priced in by December.
Meanwhile, markets have adopted a much more hawkish view of the Federal Reserve. Fed funds futures are now pricing in nearly a 90% probability of a rate hike by the end of 2026. As a result, US-Japan rate differentials are expected to remain wide, continuing to support the dollar against the yen.
USD/JPY is now approaching a key resistance level near 161.75, corresponding to the high reached in July 2024. A sustained move above that level may indicate scope for further gains, with the next minor area of technical resistance at 164.50. Beyond that, the next major resistance region does not appear until around 180.
The main risk to this outlook remains intervention by the Japanese authorities to limit further yen weakness. However, the last intervention effort only managed to push USD/JPY back towards the 155.5 area before the move quickly reversed. This may suggest that intervention alone could struggle to alter the broader trend. Changes in expectations for Federal Reserve or Bank of Japan policy could also influence the outlook.
Written by Michael J. Kramer, founder of Mott Capital Management.
Disclaimer: CMC Markets is an execution-only service provider. The material (whether or not it states any opinions) is for general information purposes only and does not take into account your personal circumstances or objectives. Nothing in this material is (or should be considered to be) financial, investment or other advice on which reliance should be placed.
No opinion given in the material constitutes a recommendation by CMC Markets or the author that any particular investment, security, transaction, or investment strategy is suitable for any specific person. The material has not been prepared in accordance with legal requirements designed to promote the independence of investment research. Although we are not specifically prevented from dealing before providing this material, we do not seek to take advantage of the material prior to its dissemination. Brent enters oversold territory following technical breakdownGeopolitical tensions in the Middle East have led to heightened volatility in Brent crude but concerns over a broader escalation may be behind us. As a result, prices have plunged, breaking below a key support zone around $93-$94 per barrel, confirming what appeared to be a double-top pattern and sending prices towards $80 per barrel.
However, Brent is now oversold, with price trading below the lower Bollinger Band over the past two sessions and the relative strength index (RSI) falling below 30. Typically, when this combination occurs, it leads to a period of consolidation or a short-term rebound. Such a move could see Brent retrace towards its 10-day or 20-day exponential moving averages, which are currently around $89 and $94 per barrel respectively.
That said, resistance around $94 is likely to be formidable. This level has served as an important area of support since mid-April, so it will probably require a significant catalyst for Brent to break back above it.
There is also scope for Brent to continue lower. Measuring the distance from the top of the double-top pattern to the neckline suggests a downside risk of approximately $72 per barrel, depending on the exact point from which the neckline break is measured.
Written by Michael J. Kramer, founder of Mott Capital Management.
Disclaimer: CMC Markets is an execution-only service provider. The material (whether or not it states any opinions) is for general information purposes only and does not take into account your personal circumstances or objectives. Nothing in this material is (or should be considered to be) financial, investment or other advice on which reliance should be placed.
No opinion given in the material constitutes a recommendation by CMC Markets or the author that any particular investment, security, transaction, or investment strategy is suitable for any specific person. The material has not been prepared in accordance with legal requirements designed to promote the independence of investment research. Although we are not specifically prevented from dealing before providing this material, we do not seek to take advantage of the material prior to its dissemination.
The yen faces a defining weekThe Bank of Japan will announce its monetary policy decision on 16 June. Markets currently expect a greater than 90% chance of a rate hike at this meeting, which would raise the overnight rate to 1% from 0.75%.
The market will also be listening closely for any indication that a second rate hike could follow later this year. Expectations for another increase before year-end remain mixed. This will be an important consideration not only for interest rates, but also for the Japanese yen, which has continued to weaken against the US dollar, pushing USD/JPY above 160.
The 160 level has been a key area for USD/JPY, particularly after Japanese government officials intervened in the market in late April. A breakout above 160 could raise the odds of USD/JPY moving towards the highs seen in July 2024 and potentially even exceeding them.
The technical picture suggests there may still be room for further gains. The Relative Strength Index (RSI) continues to trend higher and is currently around 58. Meanwhile, the 20-day moving average has acted as support, while the upper Bollinger Band has at times provided resistance.
USD/JPY is currently bouncing from support at the 20-day moving average and could move towards the 160.75 to 161.00 region before reaching the upper Bollinger Band. Furthermore, an RSI reading of just 58 suggests the pair can continue to rise before reaching overbought conditions.
One factor that could support the yen is the recent easing of geopolitical tensions in the Middle East, which has contributed to lower oil prices. As Japan is heavily reliant on imported energy, lower oil prices could reduce import costs and the foreign currency required to pay for those imports. This could provide support for both the yen and the broader Japanese economy.
Written by Michael J. Kramer, founder of Mott Capital Management.
Disclaimer: CMC Markets is an execution-only service provider. The material (whether or not it states any opinions) is for general information purposes only and does not take into account your personal circumstances or objectives. Nothing in this material is (or should be considered to be) financial, investment or other advice on which reliance should be placed.
No opinion given in the material constitutes a recommendation by CMC Markets or the author that any particular investment, security, transaction, or investment strategy is suitable for any specific person. The material has not been prepared in accordance with legal requirements designed to promote the independence of investment research. Although we are not specifically prevented from dealing before providing this material, we do not seek to take advantage of the material prior to its dissemination. The euro may weaken further versus the US dollarThe EUR/USD fell sharply after the stronger-than-expected U.S. jobs report on June 5. The move pushed the euro below a short-term support level at 1.159 and, more importantly, out of a consolidation phase that appeared to be forming a larger bear flag pattern. As of June 8, EUR/USD appears to be bouncing from a support region around 1.151, though whether that level can hold over the longer term remains to be seen.
EUR/USD is now trading below all its major moving averages, including the 10-day and 20-day exponential moving averages, as well as the 50-day and 200-day simple moving averages. Additionally, the shorter-term 10-day and 20-day moving averages are trending lower and are now acting as resistance. This suggests there is significant overhead resistance around 1.158.
A break below support at 1.151 could trigger a decline towards 1.14. It would also suggest that EUR/USD is extending lower from its bear flag pattern and could head even lower. A measured move based on the bear flag could indicate a move towards 1.14, which would take the pair back to levels last seen in mid-March.
Meanwhile, the Relative Strength Index (RSI) has trended lower since peaking in overbought territory above 70 in late January, suggesting that EUR/USD momentum has been fading. The RSI is currently around 36 and still trending lower, which some technical analysts interpret as a sign that bearish momentum remains present.
Written by Michael J. Kramer, founder of Mott Capital Management.
Disclaimer: CMC Markets is an execution-only service provider. The material (whether or not it states any opinions) is for general information purposes only and does not take into account your personal circumstances or objectives. Nothing in this material is (or should be considered to be) financial, investment or other advice on which reliance should be placed.
No opinion given in the material constitutes a recommendation by CMC Markets or the author that any particular investment, security, transaction, or investment strategy is suitable for any specific person. The material has not been prepared in accordance with legal requirements designed to promote the independence of investment research. Although we are not specifically prevented from dealing before providing this material, we do not seek to take advantage of the material prior to its dissemination. E

Gold risks a major breakdownGold has struggled over the past several months, trading sideways in a choppy range. However, it appears to be forming a large descending triangle and is currently trading just above a key support zone between $4,375 and $4,485.
A break below this support area would be a very negative development for gold and may suggest a decline towards the $4,000 region. In addition, momentum has continued to weaken, with the Relative Strength Index (RSI) trending lower and potentially poised to accelerate to the downside.
One reason gold may struggle going forward is that the dollar has begun to strengthen. The Dollar Index appears to be consolidating within a cup-and-handle pattern on the daily chart, which could see it rise towards 100.5. That would place the index in a strong position to break out and move even higher. A stronger dollar would, of course, be a significant headwind for gold. Longer-term, the dollar index also appears to be in a process of completing a rounding bottom.
Additionally, higher oil prices have pushed both interest rates and real yields higher, increasing the carry cost of holding gold. As a result, gold is facing several headwinds that could make it more difficult for prices to strengthen and move higher.
However, if tensions in the Middle East were to ease, leading to lower oil prices, and gold were able to break above resistance around $4,600, it could trigger a rally towards the $4,800 to $4,900 region.
For now, though, unless something fundamentally changes in the outlook for the dollar and interest rates, the headwinds facing gold appear to be building.
Written by Michael J. Kramer, founder of Mott Capital Management.
Disclaimer: CMC Markets is an execution-only service provider. The material (whether or not it states any opinions) is for general information purposes only and does not take into account your personal circumstances or objectives. Nothing in this material is (or should be considered to be) financial, investment or other advice on which reliance should be placed.
No opinion given in the material constitutes a recommendation by CMC Markets or the author that any particular investment, security, transaction, or investment strategy is suitable for any specific person. The material has not been prepared in accordance with legal requirements designed to promote the independence of investment research. Although we are not specifically prevented from dealing before providing this material, we do not seek to take advantage of the material prior to its dissemination. Yen weakness builds as USD/JPY nears key resistanceUSD/JPY has been weakening against the dollar, moving above 159 and towards 159.50. The area around 159.50 has served as a modest level of support and resistance for the Japanese yen from mid-April, before the intervention seen at the end of that month.
A break above 159.50 could see USD/JPY rally towards 160.50, taking it back to the highs reached before the Japanese government's intervention. There are also signs that momentum is building, with the RSI moving towards 60, suggesting it could continue to accelerate for some time before USD/JPY reaches overbought territory.
Yen faces challenges
In addition, the Bank of Japan's next policy meeting is not until the week of 15 June, leaving the market time to further weaken the yen against the dollar, especially if the market believes the BoJ will not raise rates at the upcoming meeting. This could add pressure on the Bank of Japan ahead of its policy decision on whether to raise interest rates.
At present, markets are increasingly anticipating a rate rise by the Bank of Japan at either the June or July meeting. The odds of a hike in June currently stand at around 70%, while the odds of a hike by July are almost 80%.
Another point of weakness for the yen is that oil prices have remained elevated. Although prices have retreated somewhat, a renewed move higher towards the $100-per-barrel level could place further pressure on the Japanese currency, causing it to weaken further against the US dollar.
Written by Michael J. Kramer, founder of Mott Capital Management.
Disclaimer: CMC Markets is an execution-only service provider. The material (whether or not it states any opinions) is for general information purposes only and does not take into account your personal circumstances or objectives. Nothing in this material is (or should be considered to be) financial, investment or other advice on which reliance should be placed.
No opinion given in the material constitutes a recommendation by CMC Markets or the author that any particular investment, security, transaction, or investment strategy is suitable for any specific person. The material has not been prepared in accordance with legal requirements designed to promote the independence of investment research. Although we are not specifically prevented from dealing before providing this material, we do not seek to take advantage of the material prior to its dissemination. Silver prices reach a critical technical turning pointSilver prices have reached an important area of both support and resistance, and one way or another, it seems prices could be on the move. Currently, silver is converging around its 10-day and 20-day exponential moving averages and its 50-day simple moving average, between $74.50 and $76. Additionally, there is a strong support line for silver around $70. This support line has now been tested on a couple of occasions since the end of March.
A break below support at $74 could prompt the silver price to test the more psychologically important 200-day simple moving average, currently rising around $66.90. A break of support at that level would be a significant negative for the commodity.
However, if silver manages to hold support around the moving averages, it may rally towards a downtrend line established around $85, dating back to the beginning of March.
Implied volatility for silver has been in a steady decline. This could indicate that the optimism and bullishness seen during the autumn and early winter continue to fade. Rising prices and implied volatility were consistent trends during that period and have served as a good leading indicator of the direction of silver over the past few months. A further decline in the VXSLV could strengthen the bearish case for silver even more.
Written by Michael J. Kramer, founder of Mott Capital Management.
Disclaimer: CMC Markets is an execution-only service provider. The material (whether or not it states any opinions) is for general information purposes only and does not take into account your personal circumstances or objectives. Nothing in this material is (or should be considered to be) financial, investment or other advice on which reliance should be placed.
No opinion given in the material constitutes a recommendation by CMC Markets or the author that any particular investment, security, transaction, or investment strategy is suitable for any specific person. The material has not been prepared in accordance with legal requirements designed to promote the independence of investment research. Although we are not specifically prevented from dealing before providing this material, we do not seek to take advantage of the material prior to its dissemination. S

Brent oil nears major support as peace hopes riseOil prices are falling sharply as talks of peace between the US and Iran give traders hope that the Strait of Hormuz will remain open and that oil will begin to flow out of the region. This has brought Brent crude below $100 and is now approaching a key support range between $93 and $96.
The last time Brent reached that area of support was in early April, and it proved to be an important level that not only held but also allowed oil to rebound and push to new highs around $119. Now, that area takes on an even greater role because a break of support this time could confirm a double-top pattern that has formed in oil.
The region between $93 and $96 may now serve as the neckline of the double-top pattern, and a break below that neckline could send Brent prices back to where they traded before the war began in late February, around $72.
However, if the neckline and support area hold, it could indicate that oil prices are heading back towards the previous highs near $119 and, more importantly, could eventually move even higher.
For now, the relative strength index has turned lower, suggesting that bearish momentum in oil has taken over and increasing the odds of a test of support.
This has quickly become a very big test for oil that may determine the next big swing in prices.
Written by Michael J. Kramer, founder of Mott Capital Management.
Disclaimer: CMC Markets is an execution-only service provider. The material (whether or not it states any opinions) is for general information purposes only and does not take into account your personal circumstances or objectives. Nothing in this material is (or should be considered to be) financial, investment or other advice on which reliance should be placed.
No opinion given in the material constitutes a recommendation by CMC Markets or the author that any particular investment, security, transaction, or investment strategy is suitable for any specific person. The material has not been prepared in accordance with legal requirements designed to promote the independence of investment research. Although we are not specifically prevented from dealing before providing this material, we do not seek to take advantage of the material prior to its dissemination. The USD/JPY may be heading higherThe USD/JPY has now climbed back above the 158.5 level, which had previously served as support for the currency pair before the apparent Japanese government intervention on 30 April.
This is an important level for the currency pair to hold, as doing so would effectively return the pair to its pre-intervention trading range. It also suggests that the government’s attempt to intervene in the FX market has not been particularly successful at this stage.
It may even embolden traders to push USD/JPY back towards the 160 level once again, to test whether the government responds this time or there is no reaction at all. If there is no response, it could allow USD/JPY to break through resistance at 160 and rally back towards the highs last seen in July 2024, around 161.5–162.
However, if USD/JPY is unable to hold support at 158.5, it is likely to retrace lower towards the support region around 155.50.
Currently, the RSI is consolidating and is not offering a particularly clear directional signal. We have one trendline pointing lower, while another, drawn from the lows established in January 2026, is pointing higher.
Overall, the yen has not materially strengthened despite the intervention. But with rising rates in Japan and higher oil prices, the pressure remains on both the government and the central bank to support the currency.
Written by Michael J. Kramer, founder of Mott Capital Management.
Disclaimer: CMC Markets is an execution-only service provider. The material (whether or not it states any opinions) is for general information purposes only and does not take into account your personal circumstances or objectives. Nothing in this material is (or should be considered to be) financial, investment or other advice on which reliance should be placed.
No opinion given in the material constitutes a recommendation by CMC Markets or the author that any particular investment, security, transaction, or investment strategy is suitable for any specific person. The material has not been prepared in accordance with legal requirements designed to promote the independence of investment research. Although we are not specifically prevented from dealing before providing this material, we do not seek to take advantage of the material prior to its dissemination.
EUR/USD may weaken further as key support breaksThe EUR/USD has been weakening in recent days and has now fallen below support at 1.166, a level that could prove critical if not regained quickly. If sustained, the decline would likely confirm a double-top pattern in the EUR/USD and suggest the pair could weaken further in the days ahead.
Currently, the EUR/USD has fallen to the lower Bollinger Band, which is acting as a support level. However, that support is likely to be only temporary because Bollinger Bands expand and contract daily, and at least for now, the Relative Strength Index (RSI) is only at 44, suggesting that the EUR/USD is not yet technically oversold.
If support has been broken and the double-top pattern is confirmed, the EUR/USD could have room to fall towards 1.151, measured from the closing high on 15 April to the neckline around 1.166.
However, if the EUR/USD can hold support and move back above the neckline, now serving as resistance at 1.166, it is possible this will turn into a false break, allowing the EUR/USD to recover its recent losses and potentially push back towards resistance at 1.177, which would erase the decline seen over the prior trading sessions.
Written by Michael J. Kramer, founder of Mott Capital Management.
Disclaimer: CMC Markets is an execution-only service provider. The material (whether or not it states any opinions) is for general information purposes only and does not take into account your personal circumstances or objectives. Nothing in this material is (or should be considered to be) financial, investment or other advice on which reliance should be placed.
No opinion given in the material constitutes a recommendation by CMC Markets or the author that any particular investment, security, transaction, or investment strategy is suitable for any specific person. The material has not been prepared in accordance with legal requirements designed to promote the independence of investment research. Although we are not specifically prevented from dealing before providing this material, we do not seek to take advantage of the material prior to its dissemination. USD/CAD nears major breakout as Fed rate cut hopes fadeThe USD/CAD may be poised to rise in the coming weeks as interest rate differentials between the U.S. and Canada widen. The latest U.S. inflation data is likely to make it difficult for the Fed to cut rates in 2026, and it may even have been hot enough to shift the pendulum back towards the possibility of rate hikes.
This has left the USD/CAD very close to breaking out above a key resistance area around 1.37. If that occurs, the pair could rally towards 1.39, signalling further strength in the U.S. dollar against the Canadian dollar.
At present, the pair is testing resistance at the 50-day moving average near 1.37, while a more significant resistance level sits at the 200-day moving average around 1.3810. However, it is worth noting that the Relative Strength Index (RSI) momentum gauge has begun trending higher. More importantly, after reaching oversold levels in late January, the RSI has now formed a higher low, suggesting that momentum in USD/CAD continues to strengthen.
If the pair manages to break above both the 50-day and 200-day moving averages, there is a possibility that it could go on to test the long-term resistance area around 1.39, corresponding to the downtrend established at the end of 2025.
Written by Michael J. Kramer, founder of Mott Capital Management.
Disclaimer: CMC Markets is an execution-only service provider. The material (whether or not it states any opinions) is for general information purposes only and does not take into account your personal circumstances or objectives. Nothing in this material is (or should be considered to be) financial, investment or other advice on which reliance should be placed.
No opinion given in the material constitutes a recommendation by CMC Markets or the author that any particular investment, security, transaction, or investment strategy is suitable for any specific person. The material has not been prepared in accordance with legal requirements designed to promote the independence of investment research. Although we are not specifically prevented from dealing before providing this material, we do not seek to take advantage of the material prior to its dissemination.


