WTI Crude Oil 4H: Inverse Head & Shoulders SetupHi!
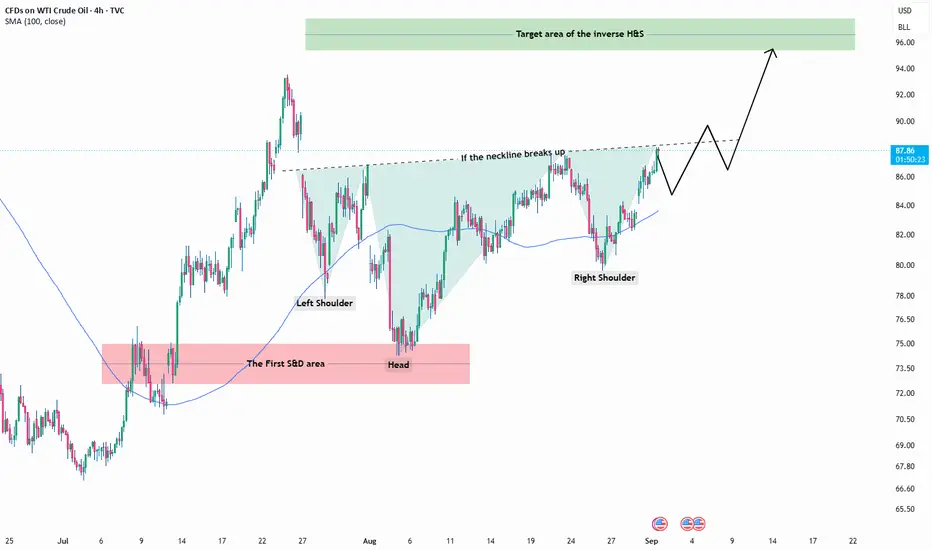
WTI Crude Oil is forming a major bullish reversal structure on the 4H chart, currently testing a key resistance zone.
📉 Technical Highlights:
Pattern: Inverse Head & Shoulders (ih&s) structure, with the Head supported by a primary Supply & Demand zone around $73.50 – $75.00.
Current Action: Price is pressing against the ascending neckline resistance around the $87.50 – $88.00 area.
Support: 100 SMA continues to slope upwards, providing dynamic support beneath the Right Shoulder.
🎯 Trade Setup:
Bullish Trigger: A solid breakout above the $88.00 neckline, followed by a pullback/retest to confirm support, provides the entry trigger.
Target Area: $95.50 – $97.00 zone (projected height of the inverse H&S formation).
Invalidation: A decline back below the Right Shoulder low (~$80.00) invalidates the bullish pattern.
⚠️ Wait for a clean 4H breakout and retest before looking for long entries.
In-depth trading ideas
Oil Approaches a Critical Reversal Zone — Watch for a TurnOil Approaches a Critical Reversal Zone — Watch for a Turn
From our previous analysis, oil fell from 87.5 to 80 dollars.
The price rose again due to the rising geopolitical tensions between the US and Iran. All major economies are worried that the price of oil could contribute a lot to a higher inflation rate.
As I have explained before, there is a strong reason why we are not seeing the price of oil at 100 or 150, despite the current situation being very bad. The only reason is that these major economies and OPEC+ are controlling to keep the price of oil as low as possible, despite this situation. At least that is my personal opinion from what I have read and understood for a long time.
So let's be careful as we may be close to a potential reversal zone again, although it is not ready to fall yet.
Watch out for signs of reversal these days because it could fall again.
You can find more details on the chart.
Thank you! 🍀
⚠️PS: Do your own analysis and use your own strategy to join the trade.
❤️ If this analysis helps your trading day, please support it with a like or comment ❤️
Crude Oil Rejection at Resistance — Bearish SetupWTI Crude Oil is approaching a strong **resistance zone around 88.8–89.2** after a sharp bullish move. The chart shows price reaching the upper boundary of the ascending channel, where a rejection could trigger a downside correction toward the lower channel support. The setup favors a **sell from the resistance area**, with bearish momentum targeting the marked level.
**🎯 Target: 83.27**
**📌 Bias: Bearish / Sell**
**⚠️ Resistance: 88.8–89.2**
WTI Oil Market Structure — FVG Reaction & Bullish TargetsWTI Crude Oil — Candle-by-Candle Market Structure Analysis
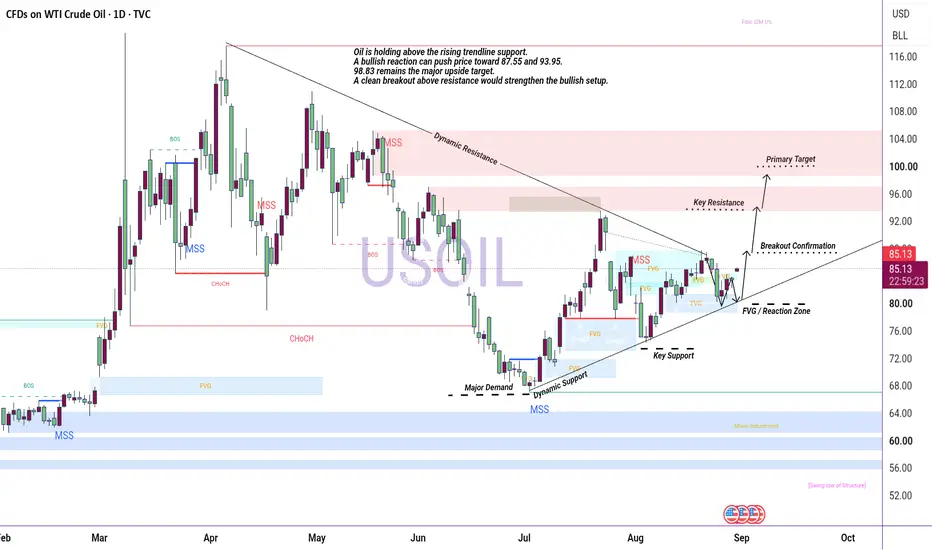
This chart presents a detailed price-action study of WTI Crude Oil using market structure, MSS, BOS, CHoCH, FVGs, liquidity levels, and dynamic trendlines.
The early candles show a period of consolidation followed by a strong bullish expansion. Successive bullish candles created higher highs and higher lows, confirming increasing buying pressure. The BOS signals highlight important structural breaks as price continued to advance.
Around the April high, price reached a major resistance area and started showing signs of rejection. The following candles created lower highs and bearish momentum, leading to multiple MSS and CHoCH confirmations. This shift indicated that sellers had temporarily gained control.
During May and June, bearish candles pushed price lower and gradually formed a broader corrective structure. Price eventually reached the 67.34–74.69 support region, where selling pressure weakened and buyers started defending the area.
From July onward, the candles began forming a recovery structure. Higher lows developed along the rising trendline, while repeated FVG reactions supported the bullish recovery. The recent candles are now consolidating around the 80–87 area, showing a battle between buyers and sellers.
The current setup is focused on the rising dynamic support and nearby FVG reaction zone. A successful bullish continuation and breakout above 87.55 could open the path toward 93.95 and 98.83. The 98.83 area remains an important resistance and primary upside target.
Overall, the chart demonstrates how each candle contributes to the bigger market structure—from consolidation and liquidity sweeps to MSS, BOS, FVG reactions, trendline support, and potential continuation targets.
This analysis is for educational and technical-analysis purposes only, not financial advice.
Elliott Wave Big PictureMy current Elliott Wave view is that the larger ABC correction from the previous major high has completed, and price may now be developing a new bullish sequence.
At this stage, it is still too early to know whether the advance from the July low will ultimately form a corrective ABC structure or develop into a larger 1-2-3-4-5 impulse. For now, I prefer to take the structure step by step and focus on the current A-B-C advance. As more price action develops, the larger-degree count can be reassessed.
The current interpretation has wave A completed, wave B completed, and wave C now developing.
For wave C, I am watching two main possibilities:
Impulsive wave C: If the internal structure develops as a clean 1-2-3-4-5 impulse, wave C could extend strongly. A common Fibonacci relationship would be around 1.618 × wave A, which on this chart corresponds to approximately 115.2.
Diagonal wave C: Wave C could instead develop as a diagonal. In that case, wave 4 may overlap wave 1, which is allowed within a diagonal. This would suggest a weaker, less impulsive structure and could make the A = C relationship around 99.6 an important Fibonacci reference.
These levels are reference zones rather than fixed targets. The main focus is on how the internal waves develop. The behavior of waves 3, 4 and 5 should provide more information about whether wave C is forming as a standard impulse or a diagonal.
There is also an alternative bearish scenario, where the structure from the July low could be developing as a triangle within wave A rather than the bullish interpretation shown here. I’m aware of that possibility, but I don’t want to overcomplicate the count at this stage. I’ll continue monitoring the internal structure and adjust the preferred scenario as price gives more confirmation.
Once wave C is complete, the next step will be to reassess the larger structure and determine whether this rise was simply an ABC correction or the beginning of a broader five-wave bullish sequence.
OILUSD Iran US War Risk Fuels Oil Breakout Key Resistance Ahead🔹 OILUSD is showing a constructive bullish market structure, with price respecting a rising channel and forming higher lows from the August swing low. Recent price action broke above the 86.5–87.5 resistance area and continued toward the 92.0 region, suggesting strengthening upside momentum. The highlighted area around 87.0 now represents an important support zone, while the upper channel boundary and liquidity area near 97.5 remain key resistance references for technical analysis.
🔸 If OILUSD holds above the highlighted support and confirms continued strength, the bullish structure could remain intact and price may continue exploring higher levels toward the upper channel area. Traders may wait for price confirmation around the support zone before considering any trade. If this support fails and price moves back below the breakout area, the structure could weaken and a deeper retracement toward previous consolidation zones might develop.
This analysis is for educational purposes only and does not constitute financial or investment advice. Always conduct your own research before making trading decisions.
When Oil Turns Violent, Two Machines Dump Your Bonds First.◼️ EXECUTIVE SUMMARY
When oil spikes, everyone braces for higher pump prices and inflation. That story is real, but it is slow and it is second. The first hit lands in the bond market, within hours, and it is not driven by oil traders. It is driven by automated sellers who have no view on oil at all. The trigger is oil VOLATILITY, not the price. When oil gets violent, the two biggest rules-based selling machines in fixed income are forced to dump US Treasuries at the same moment, pushing yields up and repricing your mortgage long before gas moves. This is a plumbing shock, not an inflation print.
◼️ THE TRIGGER: VOLATILITY, NOT PRICE
The machines size their selling off how fast oil is moving, measured by the OVX (Cboe Crude Oil Volatility Index), not the level of Brent. OVX ran from the high-20s to about 126 in the 2026 oil war, against a record close of 325 in April 2020. A smooth 40% rally barely moves them. A violent one forces their hand.
◼️ THE TWO MACHINES
Machine one: the ~$9.3T agency mortgage-bond market. As yields rise, refinancing slows, mortgages last longer, and the bonds' duration extends. To stay hedged, holders must SELL Treasuries into a falling market, which pushes yields higher, which extends duration further. A self-reinforcing loop called negative convexity.
Machine two: ~$2T of volatility-targeting and risk-parity funds. When measured volatility jumps, their risk model breaches its limit and forces mechanical de-leveraging. They sell the most liquid thing they own, Treasuries, regardless of value.
Neither has an opinion on oil, inflation, or bonds. Both are wired to sell the same asset at the same moment a shock arrives.
◼️ THE PROOF (2026 OIL WAR)
As war drove WTI from ~$70 to $111, the safe asset did NOT rally. It sold off. The 30-year yield crossed 5% for the first time since 2007, then hit ~5.33%, the highest since 2002. Convexity hedging was visible in the tape: a 33,000-contract 5-year futures block versus a typical 5,000 to 8,000. Oil eased after April. Yields kept grinding up.
◼️ THE ORDER OF ARRIVAL
Treasury yield: hours. Mortgage rate: days. Gas pump: 2 to 6 weeks. CPI print: weeks and revised. Everyone watches the last two boxes. The damage is done in the first two.
◼️ THE EDGE
The machine is loudest coming off a calm, low-rate base, when convexity is live and funds have re-levered into the quiet. Calm is not the all-clear, it is the wind-up. Watch the OVX, not the pump.
USOIL 30Min Engaged ( Bearish Reversal Detected )HANZO MARKET LIQUIDITY REPORT
USOIL
Timeframe: 30min (Volume Basis)
Scale: Higher Timeframe Context / Deep Volume analysis
━━━━━━━━━━━━━━━━━━━━━━
Market Observation
This analysis is focusing on structural behavior, liquidity zones, Volume analysis
and key areas of interest within the current range.
━━━━━━━━━━━━━━━━━━━━━━
Market Bias
Full liquidity Map
━━━━━━━━━━━━━━━━━━━━━━
🔥Bearish Reversal
Key Volume Zone : 90.70 Area
━━━━━━━━━━━━━━━━━━━━━━
Structure Factors:
• Higher timeframe Volume reaction level
• High-volume / Hidden
• Range Defend structure
• Volume Stacking
• Quarter Volume
WTI Tests Its 100-Session Moving Average!As shown in the attached chart, WTI crude is currently trading near a key price zone that could mark a turning point in its price movement. This follows a 3.5% gain since the beginning of the week.
Attention will now turn to whether prices can break above the key technical resistance near $88 per barrel. The technical significance of the $88 level can be outlined as follows:
It coincides with a descending trendline that has resisted several previous breakout attempts.
The 100-session moving average is acting as resistance around this level.
It represents a horizontal resistance level formed by two previous highs.
The key driver supporting prices has been renewed concerns over energy supplies and production infrastructure in the Middle East. Data also showed that the number of cargo vessels fell to just five, well below the 10-day average of 14 vessels per day. Declining global oil inventories are another factor influencing price movements. Will WTI manage to break above this technical resistance, or could a sudden easing of tensions push prices lower?
CRUDE OIL (US/OIL): Bullish Reversal Confirmed?!📈Crude oil turned bullish after testing the horizontal support level yesterday.
I see a confirmed bullish reversal pattern now: a cup & handle with a broken horizontal neckline.
I think that the market will continue growing and reach at least the 84.76 level soon.
USOIL Consolidation Repeated Rejection & Downside RiskUSOIL is trading around 86.40 after recovering from the 80–81 demand area, but price continues to face strong resistance around 87.00–89.00. The repeated rejection from this upper supply zone suggests that buyers are struggling to sustain momentum above the major resistance and rising trendline.
However, the fundamental picture is currently mixed rather than purely bearish. Fresh U.S.–Iran hostilities have increased concerns about disruptions through the Strait of Hormuz, which is supporting oil prices in the short term. WTI was around $86.59 on September 1, with prices rising on renewed Middle East supply-risk concerns.
From a technical perspective, a failure to break and hold above 87.00–89.00 could trigger another pullback toward 84.00, followed by 81.00 and potentially the 78.00 liquidity/support zone. A confirmed break below 84.00 would strengthen the bearish continuation setup.
Hope you found this analysis helpful. 👍
Like, Comment & Follow for more updates. Trade safe.
US Oil Daily CLS Model 2Hi Friends, New CLS Range has been created and Im looking for Long Model 1 trade setup. As always after the manipulation in to the Key Level, below the CLS range and reaction, we need to see a confirmation switch from the manipulation phase - CIOD (change in order flow) in the the expansion.
⏳ Stay patient and enter only after candle close.
🎯 Target: 50% of the CLS range.
🎥 CLS Model 1 Video Explanation 📚 Bullish CLS Strategy Structure ⚠️ Risk Control is Key to Long Term Success
📍 Always place a proper stop loss
📍 Manage your risk per trade
📍 Stay disciplined & avoid emotional trading
📍Take the Trade only if you understand logic behind it
📍 Protect Capital First
🚀Boost | 🔁 Share | 💬 Comment | ✅Follow for more CLS setups
Adapt useful, Reject useless and add what is specifically yours.
David Perk
USOIL 30Min Engaged ( Bullish Reversal Detected )HANZO MARKET LIQUIDITY REPORT
USOIL
Timeframe: 30min (Volume Basis)
Scale: Higher Timeframe Context / Deep Volume analysis
━━━━━━━━━━━━━━━━━━━━━━
Market Observation
This analysis is focusing on structural behavior, liquidity zones, Volume analysis
and key areas of interest within the current range.
━━━━━━━━━━━━━━━━━━━━━━
Market Bias
Full liquidity Map
━━━━━━━━━━━━━━━━━━━━━━
🔥Bullish Reversal
Key Volume Zone : 85.60 Area
━━━━━━━━━━━━━━━━━━━━━━
Structure Factors:
• Higher timeframe Volume reaction level
• High-volume / Hidden
• Range Defend structure
• Volume Stacking
• Quarter Volume
WTICOUSD West Texas Oil is trading near $89.90 as it consolidates inside the decision range above $88.866 on the 4h chart.
The first scenario (Bearish) projects a breakdown below $88.866, driving price down through support at $80.749 toward the lower target near $74.648 (Weak Low).
The second scenario (Bullish) forecasts a bounce off $88.866, breaking above resistance at $92.894 (Strong High) with a retest before pushing toward the primary target near $99.351.
Both projected paths rely on how price reacts around this critical decision boundary before establishing a clear directional expansion.
Look for clear confirmation on lower timeframes inside the decision zone before entering trades.
Strictly enforce risk management rules with stops set outside key levels in case of a clear breakout or breakdown.
WTI OIL Massive break-out above April's "War" Resistance.WTI Oil (USOIL) has been trading below a Lower Highs trend-line since the April 07 High, effectively making it the 'U.S. - Iran War Resistance'. Today that Resistance broke, along with the 1D MA100 (green trend-line), after causing five Lower High rejections.
Technically, this may push the emergence of a Channel Up, which supported by the 1D MA50 (blue trend-line), may first test Resistance 1 at $93.00 and then go for a full +39.13% Bullish Leg (like July's) and hit $103.00, marginally below Resistance 2.
---
** Please LIKE 👍, FOLLOW ✅, SHARE 🙌 and COMMENT ✍ if you enjoy this idea! Also share your ideas and charts in the comments section below! This is best way to keep it relevant, support us, keep the content here free and allow the idea to reach as many people as possible. **
---
💸💸💸💸💸💸
👇 👇 👇 👇 👇 👇
USOIL | $87 Breakout or Major Rejection?USOIL | $87 Breakout or Major Rejection?
USOIL has regained strong bullish momentum and is now approaching a major technical decision zone, while renewed geopolitical tensions continue to add a risk premium to crude oil.
Escalating tensions involving the U.S. and Iran have increased concerns over energy supply and the Strait of Hormuz, supporting the latest recovery in oil prices. However, technically, buyers are now facing an important resistance area, meaning confirmation is needed before expecting another major bullish leg.
Technically
USOIL is currently testing the 86.15–87.34 Key Rejection Zone, which could determine the next major direction.
As long as the price remains below 87.34, rejection and a corrective movement remain possible.
However, a confirmed 4H candle close above 87.34 would strengthen the bullish structure and support continuation toward 90.41, followed by 93.28.
On the other hand, if the price fails to break 87.34 and starts rejecting from the current zone, 82.31 becomes the key downside confirmation level.
A confirmed break below 82.31 would support a deeper bearish correction toward 78.28. Below 78.28, bearish momentum could extend toward 74.83.
Key Rejection Zone: 86.15 – 87.34
Resistance: 87.34 – 90.41 – 93.28
Support: 82.31 – 78.28 – 74.83
Bias: Short-term momentum remains bullish, supported by geopolitical risk, but 87.34 is the key breakout confirmation. Above it, 90.41–93.28 comes into focus; rejection followed by a break below 82.31 would shift momentum bearish.
WTI Eyes Geopolitical Risk- Last Week Recap | 31 AUG–4 SEP 2026
WTI surged over the past week as tensions between the United States and Iran intensified, raising concerns over potential Supply Disruptions and the transportation of crude oil through the Strait of Hormuz. The significant decline in vessel traffic through the Strait further heightened concerns over global oil supply.
Meanwhile, Ukrainian attacks on Russian refineries added to concerns over potential Supply Disruptions in the global oil market.
By the end of the week, WTI closed around $91.48/barrel, gaining nearly 10% WoW. Oil prices also received additional support from a larger-than-expected decline in US Crude Inventories, which fell by approximately 4.5 million barrels, reinforcing buying interest and concerns over tighter supply conditions.
- Fundamental Analysis | 7–11 SEP 2026
WTI is expected to remain Bullish but highly volatile, with Geopolitical Risk and Supply Disruptions continuing to be the key drivers amid ongoing tensions between the US and Iran.
If the conflict remains prolonged and oil transportation through the Strait of Hormuz continues to face restrictions, the market could maintain a significant Geopolitical Risk Premium, providing further support for WTI prices.
Meanwhile, US Crude Inventories will remain an important factor for short-term price direction. Following a larger-than-expected decline in US crude stocks last week, tighter supply conditions could continue to support oil prices. If inventories decline further, this could strengthen the bullish momentum, while a renewed increase in inventories could limit the upside.
However, the market should remain cautious about Global Demand, particularly from China and the global economy, which continues to show signs of slowing growth. This could limit the medium-term upside for WTI.
Overall: WTI maintains a Bullish Bias, with the market primarily focusing on the US–Iran Conflict, Strait of Hormuz, US Crude Inventories, and Global Demand. If tensions in the Middle East remain elevated, WTI could continue to move higher. However, any signs of negotiations or a normalization of Supply conditions could trigger Take Profit and a sharp correction.
Technical Analysis — WTI 4H
WTI has a Bullish outlook, with the price remaining above the EMA and EMA200 and continuing to follow an upward Trendline.
Although the market is experiencing some short-term consolidation, the broader structure remains intact. If the price can break out above 93.68, it could continue higher toward the 95.00 target.
Conversely, a break below the Trendline and key support levels could lead to further consolidation and weaken the current bullish momentum.
Bias: Bullish
Resistance: 93.68 / 95.00
Support: 91.39 / 90.74
Target: 95.00
Cut Loss: Below 90.74
Crude Oil | Three Nested Structures or a Larger Correction?⏱️ Reading Time: About 2 Minutes
On the 1-hour crude oil chart, the current structure has reached an important point where two main paths remain possible. However, for now, my primary focus remains on the bullish structure.
From the recent low, the market is showing signs of impulsive behavior and may be developing several nested 1 and 2 structures across different degrees. It is still too early to say with certainty that all of these Waves 1 and 2 have been completed, as part of the current movement may still be developing or completing its Wave 2 correction.
If this count is correct, once the final correction is completed, the market should begin to reveal impulsive behavior again and continue higher. Such a move could become part of the development of Wave 3 at a larger degree.
Of course, the exact form of this advance cannot be determined yet. The market could develop a classic impulse, continue building nested structures, or see extensions develop within some of its internal waves. For this reason, at this stage, the behavior and personality of the next wave are more important than trying to predict its exact shape in advance.
On the other hand, the bearish scenario will become more relevant if the current advance fails to maintain its impulsive character and, after reaching higher levels, begins to develop into a larger sideways corrective structure.
That correction could take the form of a Flat in one of its variations, or develop into a more complex structure such as a Double Three / Double Zigzag, where two corrective patterns unfold through Waves W and Y.
For now, the bullish structure remains the main focus. However, before reaching a final conclusion, we need to allow the market to reveal its own intentions: whether it resumes its advance with clear impulsive behavior after the current correction, or transitions into a larger and more complex corrective structure.
In the end, my goal is not to choose between a bullish or bearish market.
I simply follow the structure that the market is building.
Patterns whisper. I listen.
— Mr. Nobody
CFDs on Crude Oil (WTI)
Jun 25
US Oil – 4H Elliott Wave Update
Crude Oil: Bullish Triangle Breakout Could Fuel Inflation RisksMarkets start the week on a cautious note, with higher US yields and renewed geopolitical tensions weighing on risk sentiment. Fed Chair Warsh delivered a more hawkish message on Friday, pushing expectations for a September rate hike close to 60% and sending the US 2-year yield back above 4.3%. Meanwhile, fresh tensions between the US and Iran have pushed crude oil higher, adding to inflation concerns.
And if we look at oil, we see price is back to the upside amid ongoing geopolitical tensions in the Middle East. As you know, we are still tracking a triangle in wave B, which is a bullish pattern, but it may still be incomplete. Notice that price is now approaching the upper trend line resistance, so gains could be limited before a potential wave E pullback. Support is around $82, with deeper support at $78. Overall, it's still sideways price action, but sooner or later the market could be looking for a move into that gap at $91.46.
WTICrude Oil is trading inside a large symmetrical triangle on the daily timeframe, developing since around June/July. The upper trendline (resistance) began near 116.00 and has been sloping downward, while the lower trendline (support) began around 64.00–65.00 and is sloping upward. Both lines are converging toward an apex near the 76.00 area.
Price has recently pushed higher and is now trading around the 84.00–88.00 zone, testing the upper resistance trendline of the triangle. A confirmed breakout above this line could signal continuation of the upside move, but so far price is still contained within the triangle and no breakout has been confirmed.
Notes/watch points:
* Watch for a confirmed breakout above the resistance trendline (not just a wick touch)
* A daily close above the 88.00–92.00 area would be a stronger signal for continuation
⚠️ Disclaimer: This analysis is for educational and technical-illustration purposes only and should not be treated as investment or trading advice. Crude oil markets carry significant volatility and risk. Any trading or investment decision should be based on your own analysis and proper risk management. AXP and the author of this analysis accept no responsibility for any financial losses.
WTI CRUDE OIL: tageting at least $104.00 on newly formed ChannelWTI Crude Oil is bullish on its 1D technical outlook (RSI = 66.980, MACD = 2.770, ADX = 33.054) as it is unfoldind the 2nd bullish wave of the established Channel Up. Having held the 1D MA50, it is now using it as Support to go higher. Expect at least another +39.64% bullish wave in total (TP = 104.00), before the real test of the R Zone.
## If you like our free content follow our profile to get more daily ideas. ##
## Comments and likes are greatly appreciated. ##
Energy Market — WTI: levels and drivers Oil now has a rare combination: the fundamental background still supports price, but short-term technicals require confirmation from buyers. WTI is holding around $90–91 after a three-day rally of roughly 9%, while Brent remains near $95–96.
The main market focus is the risk of disruption around the Strait of Hormuz amid renewed U.S.-Iran tensions. As long as this risk remains, a geopolitical premium stays priced into oil.
On the 30-minute USOIL chart, the latest price is near 90.23. After trying to extend the rally, price moved back below short-term moving averages: EMA 9 at 90.34, EMA 20 at 90.52, and SMA 50 at 90.48. RSI is around 43, while MACD is close to the zero line and weakening. This does not break the broader recovery, but it shows that the market is digesting the impulse instead of building a clean one-way trend.
What supports price
The first factor is geopolitics. Right now, the market is pricing the risk of possible disruptions in a key maritime corridor, not a confirmed physical supply cut. This risk premium explains a significant part of the recent rally.
The second factor is inventories. The latest EIA report for the week ending August 28 showed that U.S. commercial crude inventories fell by 4.5 million barrels to 424.5 million barrels. This supports the bullish side, although inventories are still about 1% above the five-year average.
Why impulse does not yet mean sustainable trend
The same EIA report also includes a more cautious signal: the four-week average of total U.S. petroleum product demand was around 20.4 million barrels per day, down about 4% year over year. Gasoline demand was down around 2%, while distillate demand fell by 6%.
In other words, the inventory draw helps oil, but it does not confirm stronger underlying demand by itself. If the Middle East headline risk fades, the market may return to the real demand picture.
Another macro signal came from the bond market. Dow Jones notes mentioned lower oil prices as one of the factors helping cool European bond yields. This matters because oil is now influencing not only the commodity market, but also inflation expectations, rates, and broader risk sentiment.
Daily scenario
The base case is consolidation with high headline risk. As long as USOIL stays between 89.87 and 91.38, the market is digesting the rally and reacting to Middle East headlines.
A recovery above 90.48–90.52, followed by a break above 91.38, would improve the short-term structure and bring 92.06 back into focus. A move below 89.87 would shift attention to 89.06, while losing that zone would open the way toward 87.52.
Oil remains strong from the news background, but intraday momentum has already cooled. The key question is whether WTI can hold its geopolitical premium if the headlines become quieter.
Not financial advice.