Why the S&P 500 Can Rally While Most of Your Stocks StruggleThe S&P 500 SPCFD:SPX is up, financial TV is celebrating another strong session and somewhere a strategist is already explaining why the rally confirms their year-end target.
You open your TradingView watchlist expecting a sea of green and find something rather different: half your stocks are
US 500 Index
No trades
No trades
Index info
The S&P 500 measures the stock performance of 500 large US corporations listed on national exchanges. Rather than tracking the entire market, it includes companies selected for their massive market size, strong liquidity, and consistent profitability. The index applies a market-capitalization weighting system. This means that when highly valued companies like Apple or Amazon experience price changes, they move the overall index much more than smaller constituents do. Because it captures roughly 80% of available US market capitalization, traders rely on the S&P 500 for broad market exposure, trading it actively through ETFs, options, and futures contracts.
Bearish drop off?S&P500 (US500) is reacting off the pivot and could reverse towards the 1st support, which has been identified as a pullback suport.
Pivot: 7,644.68
1st Support: 7,575.55
1st Resistance: 7,727.80
Disclaimer:
The opinions given above constitute general market commentary and do not constitute the o
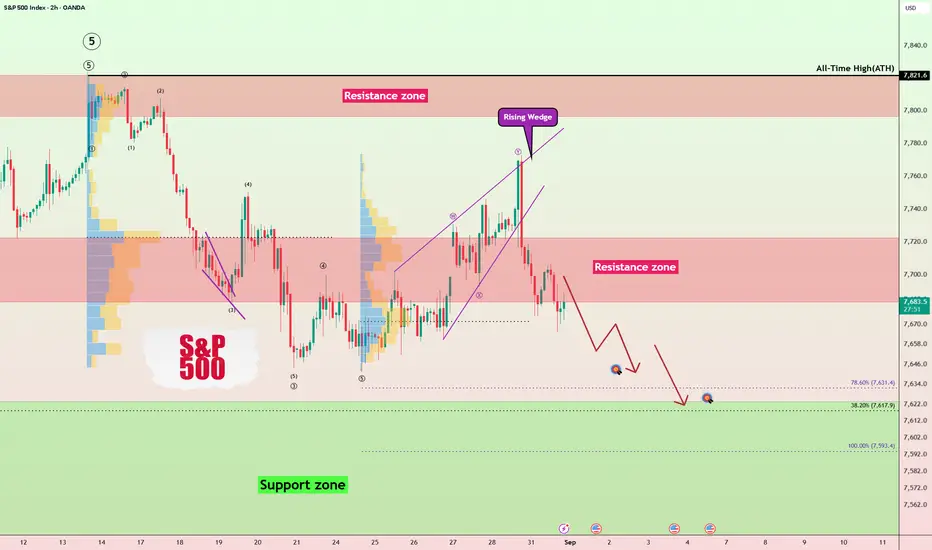
S&P 500 Back Below Resistance: Is a Deeper Correction Starting?After Warsh’s remarks pushed the U.S. Dollar Index(DXY) and the U.S. 10-Year Treasury Yield higher, the S&P 500 ( FOREXCOM:SPX500 ) moved back below the key $7,720 trading level.
The index is now trading below the Resistance Zone, while macro and geopolitical risks continue to build.
Can the S&P
US 500 – Preparing For Payrolls VolatilityYesterday the US 500 index rallied 0.3%, breaking a losing streak that had extended to 3 days immediately following the comments made by Federal Reserve Chair Kevin Warsh from the Jackson Hole on Friday, that were deemed to be more hawkish than many traders had been expecting and positioning for.
S&P 500 showing weakness after a long periodS&P 500 showing weakness after a long period
Look at the chart before you read anything.
The candles are the SPCFD:SPX . The blue line is AMEX:EEM , the emerging markets index.
The S&P made a top earlier this summer, and in August it made a higher one. Emerging markets did the opposite . Th
SPX Just Swept SSL. Now Watch the Upside.S&P 500 has just swept sell-side liquidity (SSL) around the 7,655–7,660 area, creating a potential liquidity-driven reversal setup.
Market Structure Insight
Price is reacting from the recent sell-side pool after a corrective decline. The projected path favors a bullish continuation toward the liqui
S&P500 corrects every time to this level in last 17 years.The S&P500 index (SPX) has been trading within a Channel Up since the March 2009 U.S. Housing Crisis bottom. Within this pattern, the market has periodically peaked and then pulled-back to test at least the 1W MA200 (orange trend-line).
The first line of Support has been the 1W MA100 (green trend-l
SPX did not break down, 7900 likelyNo breakdown and now we're coming out of a channel. Unless it reverses today, there's a good chance this is a breakout to 7900. So another high looks likely. The 4 hr bullish divergence also should not be ignored here. Some beaten down sectors will likely rally hard if this is correct.
If they take
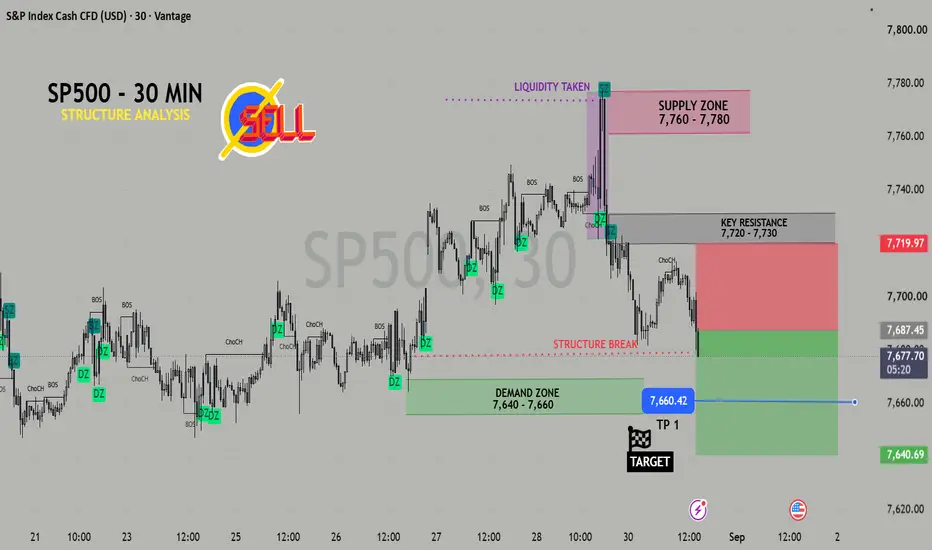
SP500 30M — BEARISH BREAKDOWN: SELLERS TARGET 7,640SP500 30M — Bearish Analysis 🔴
Current bias: Bearish. Price rejected strongly from the 7,760–7,780 supply zone after taking liquidity above the prior high.
Structure: The bullish sequence has shifted into a bearish structure, with a CHOCH followed by a structure break.
Key resistance: 7,720–7,730. T
Update on the markets. Break out coming! Will it be a fake out?!In this video I go over with my subscribers my levels of support and resistance and my out look on the markets. In summary: in the short term we are into a technical area of resistance, and we have a negative divergence on the SPX that hasn't touched the trend line on the RSI. Were thinking that it
See all ideas
Displays a symbol's value movements over previous years to identify recurring trends.
Frequently asked questions
US 500 Index reached its highest quote on Aug 13, 2026 — 7,817.4 USD. See more data on the US 500 Index chart.
The lowest ever quote of US 500 Index is 666.8 USD. It was reached on Mar 6, 2009. See more data on the US 500 Index chart.
US 500 Index is just a number that lets you track performance of the instruments comprising the index, so you can't invest in it directly. But you can buy US 500 Index futures or funds or invest in its components.