Why the S&P 500 Can Rally While Most of Your Stocks StruggleThe S&P 500 SPCFD:SPX is up, financial TV is celebrating another strong session and somewhere a strategist is already explaining why the rally confirms their year-end target.
You open your TradingView watchlist expecting a sea of green and find something rather different: half your stocks are down, several sectors look miserable and that one small-cap position has apparently received only some of the good news.
Welcome to one of the stranger features of modern markets. The S&P 500 can rise even when a surprisingly large number of its members are falling (even as many as 493).
Understanding why requires looking underneath the headline index, where 500 companies have very different amounts of voting power.
⚖️ Five Hundred Stocks, Very Unequal Influence
The S&P 500 is a float-adjusted market-cap-weighted index spread across 11 sectors . In plain English, larger publicly tradable companies carry greater weight, so their price movements have a much bigger effect on the index.
Think of it as a shareholder meeting where everyone gets invited, but Nvidia’s NASDAQ:NVDA Jensen Huang arrives carrying a considerably louder microphone.
By mid-2026, the 10 largest members represented roughly 36% of the entire S&P 500, while the single largest accounted for about 7.5% (this is, again, Nvidia).
That means moves in Nvidia NASDAQ:NVDA , Apple NASDAQ:AAPL , Microsoft NASDAQ:MSFT , Alphabet NASDAQ:GOOGL , Amazon NASDAQ:AMZN , Meta NASDAQ:META and Tesla NASDAQ:TSLA (that’s the Magnificent Seven) can overpower weakness across dozens, sometimes hundreds, of smaller companies.
🐋 One Whale Can Move Plenty of Water
Imagine one mega-cap stock carrying a 7% index weight rises 5%. Its contribution alone adds roughly 0.35 percentage points to the S&P 500, before considering anything else.
Now imagine 50 much smaller constituents each decline modestly. Plenty of stocks are having a bad day, yet the headline index can still finish comfortably higher because the biggest companies are doing the heavy lifting.
This helps explain why traders sometimes feel disconnected from the market they supposedly own. The S&P 500 tells you how the weighted collection performed. It doesn't tell you how the typical stock performed. For that, we need another concept.
🌊 Meet Market Breadth
Market breadth measures how widely a market move is being shared across individual stocks. There’s good, healthy breadth and there’s bad breadth (not breath).
One simple measure is the advance-decline line , which compares the number of rising stocks with the number of falling stocks over time. Traders can also watch the percentage of companies trading above their 50-day or 200-day moving averages.
If the S&P 500 keeps climbing while fewer stocks participate, the rally is becoming narrower. If more companies, sectors and industries start joining the advance, breadth is improving. That’s also what happened Wednesday — markets showed a healthier breadth .
🪞 Try Looking at the Same 500 Differently
There's an especially useful trick here: compare the regular S&P 500 with the S&P 500 Equal Weight Index INDEX:SPXEW .
It contains the same companies but gives each roughly 0.2% weight at its quarterly rebalance. Nvidia therefore gets just about the same influence as a much smaller constituent rather than dominating through sheer size.
When the regular S&P 500 SPCFD:SPX races higher while equal weight struggles, mega-caps are probably doing disproportionate amounts of work. When both advance together, participation is much broader.
It's essentially the difference between asking, "How wealthy is everyone in this room combined?" and "How is the average person in this room doing?" Those questions can produce dramatically different answers.
🚨 Is Narrow Breadth a Warning?
Sometimes. But this is where traders should resist turning an indicator into a prophecy.
A narrow rally can continue for months because the biggest companies may genuinely have the strongest earnings growth, margins and investor demand. Leadership can also broaden later as other sectors catch up.
What narrow breadth tells you is that the market's performance has become more dependent on fewer companies. If those leaders stumble, fewer stocks underneath them are available to keep the index elevated.
🔍 Look Under the Hood
So next time the S&P 500 jumps 1%, don’t jump to conclusions. Check how many stocks advanced versus declined. To do that, go to the TradingView Stock Screener → Index → S&P 500 then hit the Chg % dropdown and select Above 0% and Below 0% for precise listings.
Compare the regular index with equal weight. Look at sector performance. Then ask whether the rally is spreading or being carried by a handful of familiar giants.
The S&P 500 remains one of the world's most useful gauges of large-cap US equities, covering roughly 80% of available US market capitalization. But like every index, it compresses hundreds of individual stories into a single number.
Off to you : How do you read and trade the S&P 500 in your day to day? Share in the comments!
S&P Index Cash CFD (USD)
No trades
No trades
In-depth trading ideas
Bearish drop off?S&P500 (US500) is reacting off the pivot and could reverse towards the 1st support, which has been identified as a pullback suport.
Pivot: 7,644.68
1st Support: 7,575.55
1st Resistance: 7,727.80
Disclaimer:
The opinions given above constitute general market commentary and do not constitute the opinion or advice of IC Markets or any form of personal or investment advice.
Any opinions, news, research, analyses, prices, other information, or links to third-party sites contained on this website are provided on an "as-is" basis, are intended to be informative only, and are not advice, a recommendation, research, a record of our trading prices, an offer of, or solicitation for, a transaction in any financial instrument and thus should not be treated as such. The information provided does not involve any specific investment objectives, financial situation, or needs of any specific person who may receive it. Please be aware that past performance is not a reliable indicator of future performance and/or results. Past performance or forward-looking scenarios based upon the reasonable beliefs of the third-party provider are not a guarantee of future performance. Actual results may differ materially from those anticipated in forward-looking or past performance statements. IC Markets makes no representation or warranty and assumes no liability as to the accuracy or completeness of the information provided, nor any loss arising from any investment based on a recommendation, forecast, or any information supplied by any third party.
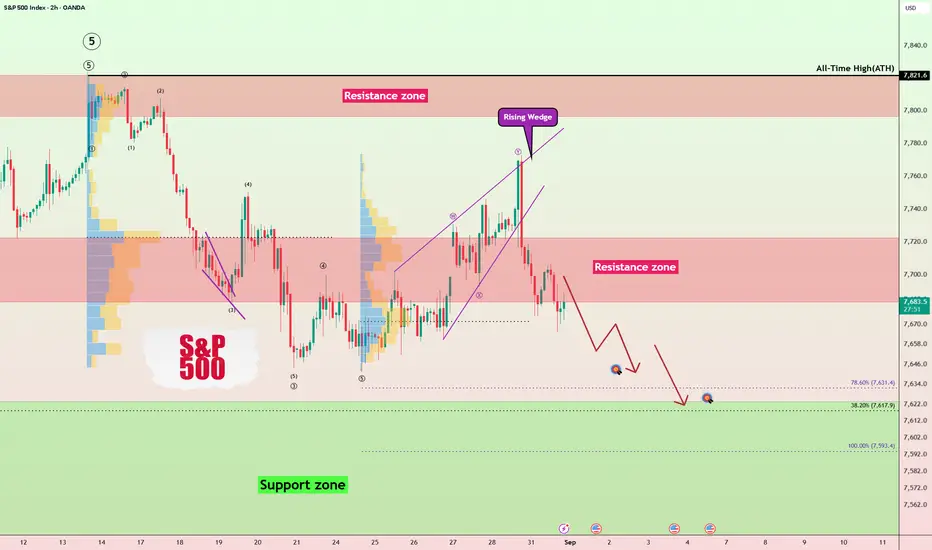
S&P 500 Back Below Resistance: Is a Deeper Correction Starting?After Warsh’s remarks pushed the U.S. Dollar Index(DXY) and the U.S. 10-Year Treasury Yield higher, the S&P 500 ( FOREXCOM:SPX500 ) moved back below the key $7,720 trading level.
The index is now trading below the Resistance Zone, while macro and geopolitical risks continue to build.
Can the S&P 500 reclaim $7,722, or is a deeper correction toward the Support Zone beginning?
Macro Outlook
Warsh’s hawkish remarks strengthened the U.S. dollar and pushed Treasury yields higher, creating additional pressure on U.S. equities.
At the same time, renewed military tensions in the Middle East remain an important risk factor. Any escalation could put further pressure on the S&P 500 and broader risk assets.
Technical Analysis
From an Elliott Wave perspective, the S&P 500 appears to have completed its corrective waves inside a Rising Wedge Pattern, suggesting that the next bearish waves could now begin.
💡 Educational Note: A Rising Wedge often signals weakening bullish momentum. A confirmed breakdown can increase the probability of a deeper corrective move.
I expect the S&P 500 to continue its bearish trend and decline toward the Support Zone and the $7,634 level.
Trade Setup
First Take Profit(TP): $7,643
Second Take Profit(TP): $7,634
Stop Loss(SL): $7,723
Key Trading Levels: $7,670 _ $7,722
Which level do you think the S&P 500 will reach first?
🔴 $7,634
🟢 $7,723
📌 S&P 500 Analysis(SPX), 2-hour time frame.
🛑 Always use proper risk management and set a Stop Loss(SL) for every position.
🚀 If this analysis helps your trading plan, a BOOST would help more traders discover it.
US 500 – Preparing For Payrolls VolatilityYesterday the US 500 index rallied 0.3%, breaking a losing streak that had extended to 3 days immediately following the comments made by Federal Reserve Chair Kevin Warsh from the Jackson Hole on Friday, that were deemed to be more hawkish than many traders had been expecting and positioning for.
Interestingly, the 3-day decline held against a potentially important technical level, (more detail in technical section below) with traders seemingly happy to buy the dip while US corporate earnings remain solid and the oil price drops back slightly from 6-week highs.
However, despite the rebound in prices from their lows around 7615, trader uncertainty remains regarding the unstable situation in the Middle East, the impact of rising inflation on Fed interest rate policy and the outcome of this Friday’s US Non-farm Payrolls release (1330 BST). All of which has combined to help keep volatility elevated moving towards the weekend.
Looking forward to Friday’s US jobs report, while the headline number is often volatile, sentiment and positioning in the US 500 may be influenced by whether the unemployment rate moves above or below its current level of 4.1% and by the relative strength of average hourly earnings. Any deviation from market expectations may impact the decision making of Fed policymakers when they meet on September 16th to decide their next rate move. This could mean the payrolls outcome may have direct implications for the short-term direction of the US 500 back up towards all-time highs at 7817 (August 13th), or perhaps down towards new lows below 7615.
Technical Update: Price Weakness Finding Support at 38.2% Fibonacci Retracement Level
Having posted a new all‑time high at 7817 (August 13th), the US 500 index has entered a period of price consolidation. This type of activity is often seen after a strong advance, acting as a natural reaction to what were perhaps over‑extended upside conditions.
The challenge for traders in this environment may be attempting to determine whether the latest price weakness is, as has been the case previously, a limited downside correction from which fresh strength can reemerge, or if it represents a more meaningful negative sentiment shift that could lead to further deeper declines. For the upcoming sessions into the Friday close it could be useful to identify potential key support and resistance levels that may play an important role in shaping the next directional themes.
Potential Support Levels:
Recent declines in the US 500 on Tuesday and Wednesday this week have been held by what may be seen as important support at 7615 (38.2% retracement of the July 29th to August 13th upside). This could represent the first key level for traders to focus on over the next 48 hours.
Closing breaks below 7615, while not a guarantee of further declines, could trigger a deeper retracement of the price strength developing from the July 29th low. Breaks of 7615 could open scope toward 7534 (50% Fibonacci retracement), and possibly then 7492, (deeper 61.8% level).
Potential Resistance Levels:
While support at 7615 (38% retracement) remains intact on a closing basis, fresh attempts to push back towards the upside could emerge. In this scenario, the focus for traders may be on potential resistance at 7708 (Bollinger mid‑average).
Closing breaks above 7708 could lead to further price strength to challenge the August 28th high at 7771 and, if this level were also to give way, back to 7817 (August 13th high).
The material provided here has not been prepared accordance with legal requirements designed to promote the independence of investment research and as such is considered to be a marketing communication. Whilst it is not subject to any prohibition on dealing ahead of the dissemination of investment research, we will not seek to take any advantage before providing it to our clients.
Pepperstone doesn’t represent that the material provided here is accurate, current or complete, and therefore shouldn’t be relied upon as such. The information, whether from a third party or not, isn’t to be considered as a recommendation; or an offer to buy or sell; or the solicitation of an offer to buy or sell any security, financial product or instrument; or to participate in any particular trading strategy. It does not take into account readers’ financial situation or investment objectives. We advise any readers of this content to seek their own advice. Without the approval of Pepperstone, reproduction or redistribution of this information isn’t permitted.
S&P 500 showing weakness after a long periodS&P 500 showing weakness after a long period
Look at the chart before you read anything.
The candles are the SPCFD:SPX . The blue line is AMEX:EEM , the emerging markets index.
The S&P made a top earlier this summer, and in August it made a higher one. Emerging markets did the opposite . Their best moment came in the spring, and the top it made this month is clearly lower.
For the first time since early 2025 , the two are walking in different directions.
I said the opposite in January
In January I wrote that the picture looked healthy . Both indices were making new highs together, and I told my readers to keep holding. SPCFD:SPX did a 15% since my post.
That was the honest reading then. Now, a divergence appeared.
Why that blue line matters
Emerging markets are the most nervous money. When big investors start to worry, this is what they sell first . It is easy to sell and it is hard to defend in a meeting.
So the S&P can keep climbing on a handful of large names while the risky money is already walking out of the building.
The index still looks strong. The crowd behind it is thinner than it was.
"So should I sell everything?"
No. And this is where most people get it wrong.
A smoke alarm is not a fire.
Sometimes it is only the toast. But nobody stays on the sofa when it beeps. You stand up and you go and look at the kitchen.
That is what this is. It is not a sell signal by itself. It is a reason to go and look.
Going to look means three simple things.
Do not put new money in with both hands.
Know the exact level where you would step aside on the positions you already own.
Accept that reducing your exposure a little is not a defeat, it is the price of sleeping well.
How small the sample is
I have found six of these in the last 15 years: 2011, 2014, 2018, 2020, 2021 and 2024. Every one of them was followed by a fall of between 15% and 35% in the S&P 500 in a few weeks.
Six is not a study. It is a small number and I am not going to dress it up as something bigger. I show all six charts, one by one, in the article published in January and you can see 3 examples in the current chart.
In fact, there is room to be optimistic when you look the big picture, the market is 80% overheated, but there is still some room to go up.
In short...
The S&P is printing higher tops while emerging markets print lower ones, and that has not happened since early 2025.
A warning is not an order to sell, so today the job is to check your levels, not to empty your account.
Six past cases is a small sample, and I would rather tell you that than sell you certainty. Just be careful.
I will keep watching that blue line every week. If emerging markets climb back above their spring high, the alarm was only the toast, and I will say so here.
SPX Just Swept SSL. Now Watch the Upside.S&P 500 has just swept sell-side liquidity (SSL) around the 7,655–7,660 area, creating a potential liquidity-driven reversal setup.
Market Structure Insight
Price is reacting from the recent sell-side pool after a corrective decline. The projected path favors a bullish continuation toward the liquidity resting above.
Trading Scenarios
🟢 Bullish: SSL sweep → reclaim → continuation higher.
• Conservative TP: ~7,688
• Major Liquidity: ~7,697
• Ultimate DOL: ~7,725
🔴 Invalidation: Failure to hold the swept SSL area could expose lower liquidity around 7,640.
Trading Perspective
The setup is simple: liquidity gets taken, price reclaims, then the next draw becomes the target.
Wait for confirmation. Don't chase the first reaction.
S&P500 corrects every time to this level in last 17 years.The S&P500 index (SPX) has been trading within a Channel Up since the March 2009 U.S. Housing Crisis bottom. Within this pattern, the market has periodically peaked and then pulled-back to test at least the 1W MA200 (orange trend-line).
The first line of Support has been the 1W MA100 (green trend-line), which covered the three more recent and shorter corrections of 2024, 2025 and now early 2026. However, the last time the index made contact with its 1W MA200 was on the October 2022 bottom.
In addition, it is currently on the 2nd longest streak without having the 1M RSI touch the 16-year Buy Zone, which was 228 weeks (1596 days). In May 17 2027 we will again complete 228 weeks since the last RSI Buy Zone test.
Technically, the market has a strong 'need' for another 1W MA200 test and even though it is currently around 5600, history has shown that sharp corrections do take place, like Feb-March 2020, Oct-Dec 2018, May-Oct 2011.
Also, with the exception of 2015 (which hit the 0.236 Fib), the other three 1W MA200 corrections have all tested (at least) the 0.382 Fibonacci retracement level from the previous bottom.
As a result, even though S&P500 could go a little higher to test the Top of the historic Channel Up, it appears very likely to pull-back and break below the 1W MA100, targeting at least the 0.236 Fib at 6500. By the end of the year/ beginning of next, this price level would also be close to the 1W MA200. If fundamentals (Fed hikes, geopolitics) get even worse, a 1W MA200 test by late Q1 2027 could take place near 6100 coinciding with a 1M RSI touch on its 16-year Buy Zone, but that's a less likely scenario.
Needless to say, if a 1M RSI test on that Zone takes place before any of those Targets, then the S&P500 would turn into a multi-year buy opportunity for us regardless of the price.
As a side-note, notice also how since 2008, the Time Cycles (Sine Waves) have fairly accurately caught the start of every of those major technical corrections. Based on the current Sine Wave, one should have started last year (August 2025), so technically such a Bearish Leg correction seems long overdue.
---
** Please LIKE 👍, FOLLOW ✅, SHARE 🙌 and COMMENT ✍ if you enjoy this idea! Also share your ideas and charts in the comments section below! This is best way to keep it relevant, support us, keep the content here free and allow the idea to reach as many people as possible. **
---
💸💸💸💸💸💸
👇 👇 👇 👇 👇 👇
SPX did not break down, 7900 likelyNo breakdown and now we're coming out of a channel. Unless it reverses today, there's a good chance this is a breakout to 7900. So another high looks likely. The 4 hr bullish divergence also should not be ignored here. Some beaten down sectors will likely rally hard if this is correct.
If they take out yesterday's low, then they will have a false breakout and that would be bearish. I will update if that happens.
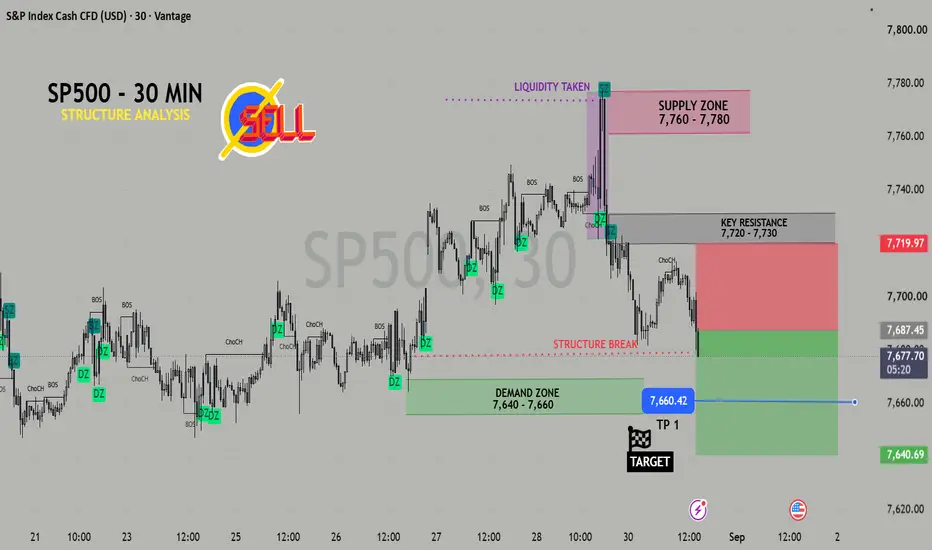
SP500 30M — BEARISH BREAKDOWN: SELLERS TARGET 7,640SP500 30M — Bearish Analysis 🔴
Current bias: Bearish. Price rejected strongly from the 7,760–7,780 supply zone after taking liquidity above the prior high.
Structure: The bullish sequence has shifted into a bearish structure, with a CHOCH followed by a structure break.
Key resistance: 7,720–7,730. This is the main pullback/sell area.
Current price: Around 7,683, so chasing the sell here carries more risk.
TP1: 7,660
TP2: 7,640
Major demand: 7,640–7,660
Invalidation: A sustained move back above 7,730 weakens the immediate bearish setup; a break/reclaim of 7,760–7,780 would invalidate the bearish idea more strongly.
Best setup: Wait for a pullback toward 7,720–7,730, then look for bearish confirmation before entering.
Overall bias: SELL 🔴 | Target: 7,660 → 7,640
Update on the markets. Break out coming! Will it be a fake out?!In this video I go over with my subscribers my levels of support and resistance and my out look on the markets. In summary: in the short term we are into a technical area of resistance, and we have a negative divergence on the SPX that hasn't touched the trend line on the RSI. Were thinking that it will touch it implying that we do get a break out, but with the RSI divergence and the 10Y bond making a bullish candle print holding the parallel its telling or giving hints that the 10y wants to go higher soon.
Also if we add our 2 month parallel from our bigger time thesis videos, the middle part of that parallel is of great significance here in this channel because its what has been helping us call out major correction moves with accuracy. The chart pattern is there, who are we to say that this time is different? We follow the pattern until its broken! That level comes with a 12 year divergence on the 2 month chart and also the stochastic on max and money flow indicator at critical levels.
In the video we say that we do get the break out but hypothesis that it will be short lived as it will run right into a significant level of resistance ( the middle part of our red parallel from the 2 month chart videos)
To be clear I do have longs I'm still holding but I'm getting more interested in slowly inching in with some shorts! But they must be at critical levels or have multiple factors to even think about starting to short them.
How gamma walls & the HVL flip frame the SPX sessionEducational post: a simple way to frame an SPX session with dealer-gamma levels (the three horizontal lines on the chart are today's levels). Nothing here is a trade call.
1) Call wall — the strike above spot with the largest call gamma (7800 today). Dealers are long gamma there and sell into rallies, so it behaves as a ceiling / rally-fade zone and often marks the upper edge of the day's range.
2) Put wall / gamma support — the strike below spot with the largest put or positive gamma (the 0DTE gamma wall near 7675 today). It behaves as a cushion / bounce zone; a clean break below it means hedging flips from dampening to chasing the move, so the tape usually gets faster below it.
3) HVL (gamma flip, 7496 today) — the level where net dealer gamma turns from positive to negative. Above it, hedging dampens moves: range days, mean-reversion, GEX magnets work. Below it, hedging amplifies moves: trend days, wider ranges, stops need more room. First thing to check every morning: which side of the HVL price opens on.
4) 1-day cone — the expected move implied by front options (roughly spot x IV x sqrt(1/252), about +/-0.7% today), drawn as a band around spot. Walls inside the cone are the ones most likely to be tested; walls outside it are lower-probability targets.
How to draw them: pull today's strikes with the largest net gamma from an options-chain / GEX source, draw horizontal lines at the call wall (resistance), the put wall (support) and the HVL (flip), then add the +/-1-day expected move as two dotted lines. Redraw every morning after the open — gamma levels expire and migrate with open interest and 0DTE flow.
Reading the session: above the HVL and between the walls = range / fade-the-edges playbook. Below the HVL = momentum playbook, wider stops, next wall becomes an accelerator rather than support. Combine with price action and volume; these levels are a map of positioning, not a prediction. Not investment advice.
S&P500 Incredible 4-year Cycle points to a strong correction.We talk about Bitcoin's 4 -year Cycle Model frequently and with good proper reason of course. But most neglect to look at and apply the same market dynamics and macro-economic reasoning on the S&P500 (SPX). The two markets are no different.
This multi-decade chart shows that for almost the last half century (the past 44 years are our sample), the S&P500 had a strong correction to either its 1W MA100 (red trend-line) or 1M MA50 (blue trend-line) every 4 years. And this correction started most of the times around July - August. The few remaining times, that correction was completed by July - August of this 4-year Cycle.
Currently, the Sine Waves point that this Cycle closes again in July - August 2026. Since we haven't had a 1W MA100 correction since March 2025, we should expect that this could happen now.
Out of the 11 corrections we've had since 1982, 5 hit the 1M MA50, 5 the 1W MA100 and 1 (July 2002, Dotcom Bubble bottom) was already significantly below both. As a result, the probabilities are even with regards to which MA period the index could target. If it aims the 1W MA100, we expect it to touch at least 6800. If it goes for a stronger 1M MA50 correction, 6200 is a fair estimate.
It is worth noting however, that the last three 4-year Cycle corrections all targeted the 1M MA50. The trend is there.
---
** Please LIKE 👍, FOLLOW ✅, SHARE 🙌 and COMMENT ✍ if you enjoy this idea! Also share your ideas and charts in the comments section below! This is best way to keep it relevant, support us, keep the content here free and allow the idea to reach as many people as possible. **
---
💸💸💸💸💸💸
👇 👇 👇 👇 👇 👇
$SPX to under $5000?I think the market has put in a top here.
While everyone is extremely bullish up here, there's already signs that we're rolling over.
I know everyone believes Bessent's moves are going to continue to be bullish for the market, but that's not what I see.
There are 2 major issues that Bessent is trying to control for:
1. USDJPY - the yen
2. TLT - the bond market
The problem is, I think he's trapped here. When he's intervened on the Yen, bonds have dropped. When he's intervened on bonds, the dollar drops.
Both USDJPY and TLT are sitting at critical levels, and if there's a policy mistake or unforeseen event over the next week that causes the dollar or bonds to drop (or both), I think we're going to see an extreme move in the market that takes us all the way back to the support level on the chart.
Lots of catalysts this week:
- PCE, NVDA earnings
- Jackson Hole
- Retaliation for d-day?
Breaking $7300 will be the warning sign.
If this were to happen, I think it will happen very quickly (yes, a crash).
I'm playing this idea via puts -- if I lose the premium so be it.
Let's see if it plays out over the coming weeks.
Summary into todays price action 8/31/26In this video I go over levels of support and resistance I'm watching out for on the charts we mentioned in the video. Gold /silver /SPX /QQQ/ and the 10Y bond. We also found another parallel in the chart on the SPX giving us more evidence that it is a valid and proper bull flag.
We're still going to proceed with caution as also here in the channel we have discussed multiple times that on our bigger time thesis on the two month we are dealing with critical levels on our indicators and warning us something big is coming soon with the 12 year divergence were testing as we speak. And the money flow indicator reaching levels of the dot com and the stochastic RSI at max levels. Big correction is coming soon we just don't know exactly when.
With that in the back of our minds were proceeding with caution at the highs, were playing the patterns until its broken and the thesis is null and voided. The charts have to tell us that and if it does fail we will be quick to act on that!
S&P500: Path towards $8000With many analysts, banks and financial institutions predicting $8000 , let’s have a look at the charts and see what is it telling us.
The S&P500 has been on a strong tear , up approximately 6% since the begining of the month reinforcing the 8000$ target and key psychological level. Now our path towards that key level is what is going to be most interesting. The chart tells us that there is a key gap near the $7500-$7550 area. So before price goes towrads the $8000, you might see a retracment towrads that area to inject more liquidity to start the big move towards the upside.
Added confluence is the 618% retracement coming in at $7500. However if that level fails to hold that this may be considered as a topping sign and the index may just begin retracing.
We cover the markets every day , giving our traders the edge they need to excel. Make sure to follow for more
Looks Like We're Going HigherOn larger timeframes the SPX move is still showing weakness while near resistance which could be bearish but I have a feeling bears has the perfect setup last week and it failed.
Granted, we did sell into the end of the week but I think that could be fit inside of an expected correction. With whatever comes early in the week ahead being important to the near term trend.
Bears I think need to see prices weak early or the bear setups have probably failed.
If we end up making a low here then this is a 2.20 > 1.27 pullback and we are likely to boom hard out of it.
Could end up seeing VIX at 13.
If this move happens, the case to short after it would be compelling.
S&P 500 Daily Chart Analysis For Week of August 28, 2026Technical Analysis and Outlook:
In the previous week's trading session, the cash index steadily rose after retesting the crucial Mean Support level at 7,643.
In the upcoming session, the S&P 500 pattern indicates a potential In-Force Rebound, which is entirely plausible. Initially, targeting the Mean Resistance level at 7,767 and extending to retest the completed Outer Index Rally at 7,815, maneuvering through the Key Resistance level at 7,800.
However, there is a possibility that the index may experience steady-to-lower price movement towards the Mean Support at 7,643 before initiating a significant upward move, as indicated by the intermediate In-Force Rebound pattern shown in the accompanying chart.
SPX500 | Bears Eye 7588
U.S. INDICES | September Slump Risk Returns
September has historically been a challenging month for U.S. equities, with major indexes tending to deliver their weakest seasonal performance during the transition from summer into fall.
The historical pattern stretches back more than a century for the Dow and several decades for the S&P 500 and Nasdaq. Small-cap stocks are also vulnerable, with September historically among the weakest months for the Russell 2000.
The market has dropped around 600 points, or approximately 1%, in line with yesterday’s bearish outlook, and has now reached the key 7649 support level.
Technically
SPX500 maintains a bearish structure following the fresh break below 7649.
As long as the price remains below 7649, bearish continuation toward 7588 remains in focus. A confirmed break below 7588 could extend the bearish trend further toward 7528.
However, after the recent decline, a corrective recovery remains possible. To strengthen the correction scenario, the price needs to reclaim 7649 with a confirmed 4H candle close above it, which could support a recovery toward 7688, followed by the key 7709 resistance.
Pivot Line: 7649
Support: 7588 – 7528
Resistance: 7688 – 7709
Update on the markets after NVDA earnings!In this video I go over all my levels of support and resistance that I'm watching on both the SPCFD:SPX and the NASDAQ:QQQ after earnings from $NASDAQ:NVDA.
I want to see if we can hold the gains, if we cant watch those levels of support and if we do go higher watch the levels of resistance. On the SPX we must make a new all time high and break the negative divergence.
Right now the markets have the narrative and the momentum to do so and if we cant, that would be a warning sign the we would still need to pull back a little more. But with our factors its more likely to get the move up the question is for how long? Is it short lived? Can we hold the gains?
S&P500: Channel Down topped. Strong Sell Signal.S&P500 marginally turned bullish again on its 1D technical outlook (RSI = 57.556, MACD = 25.700, ADX = 17.262) as it completed a 2-day rally on a bond relief, with that rally hitting the top of its 3 week Channel Down. This is technically the most optimal Sell Signal of the pattern. The previous bearish wave hit the 4H MA200 before rebounding, this one can technically aim for the 1D MA50 (TP = 7,600) currently on the -0.136 Fibonacci extension, where the previous LL was priced.
## If you like our free content follow our profile to get more daily ideas. ##
## Comments and likes are greatly appreciated. ##