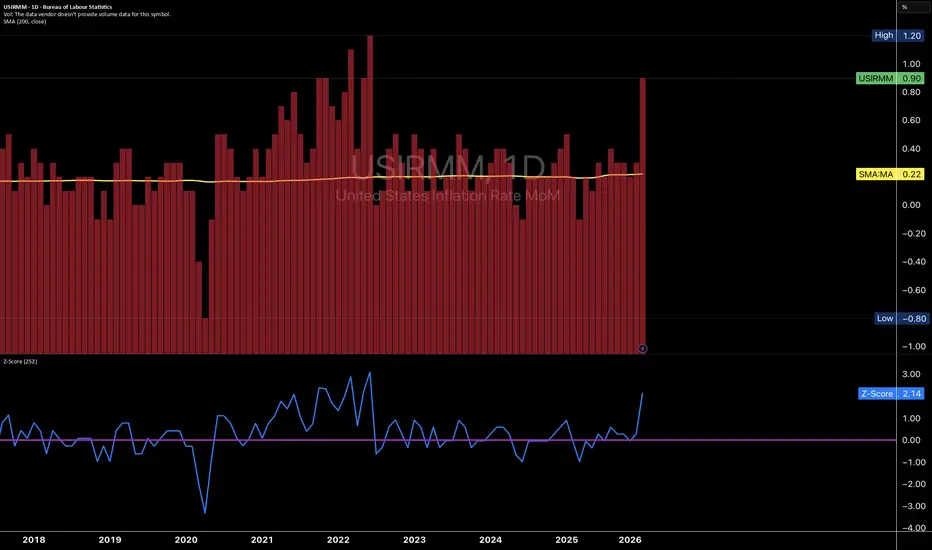
US July CPI: Disinflation Continues, but the Details Warn AgainsUS inflation moderated in July, with headline CPI rising 0.1% month on month and easing to 3.4% annually. Core inflation also declined to 2.5% year on year, but the internal composition was less dovish than the headline suggests.
In this video, we examine:
Which sectors led July’s inflation
Wh
Key data points
Last release
—
Observation period
Jul 2026
Next release
—
Forecast
—
Highest
2.00 %on Sep 30, 1947
Lowest
−1.80 %on Nov 30, 2008
Indicator info
Inflation Rate MoM measures month over month change in the price of goods and services.
Related indicators
US CPI MoM new 3.5 year highEnergy Shock Masks a Quiet Core
Headline CPI surged 0.9% m/m in March — well above the 0.7% consensus — after a modest 0.3% gain in February. On a yearly basis, total inflation accelerated to 3.3% from 2.4%.
Core CPI (ex food & energy) came in softer than expected at +0.2% m/m vs. 0.3% forecast, mat
Month on Month US Inflation Harmonically Set to Rise to 1.94%This is a followup to this year-on-year inflation chart idea posted back in June 2022:
The YoY US Inflation rate has been on a trend of going down since it tested the 1.414 PCZ of the Bearish Butterfly above, but recently we have seen the MoM rate slow its descent and form a bottoming pattern with
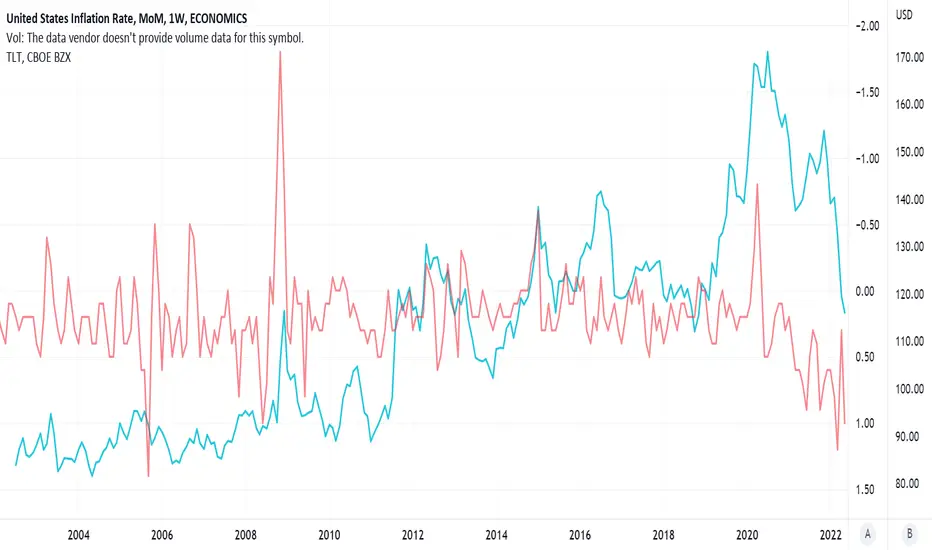
Inflation Will Recede If Oil Price Drops Chart to illustrate the oil prices as a leading indicator of month over month inflation rates.
Inflation statistics mirror oil price action with a lag of about 1-2 months.
"Federal Reserve Chair Jerome Powell said in his semiannual testimony before the U.S. Senate Banking Committee in March 2022 t
See all ideas