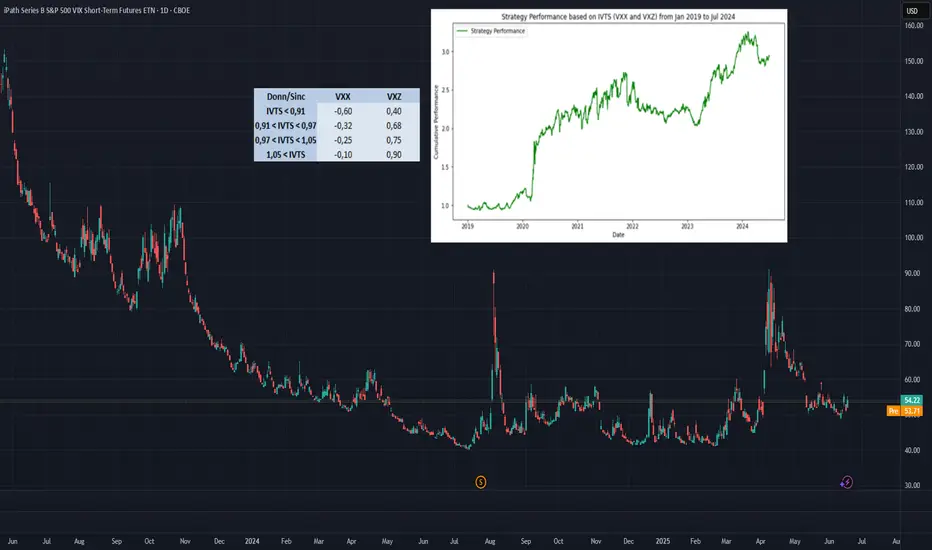
$VXX 12hour Bullish FlagCBOE:VXX has formed a bull flag and seems to be attempting to break to the upside. This implies that we can see some more downside of the S&P 500 this week. Smaller time frames are also showing higher lows being created on CBOE:VXX which is a bullish sign for them. A weak sign for the S&P.
Compare with iPath Series B S&P 500 VIX Short-Term Futures ETN
Key stats
Fund info
Home page
Inception date
Jan 19, 2018
Structure
Exchange-Traded Note
Distribution tax treatment
No distributions
Income tax type
Capital Gains
Max ST capital gains rate
39.60%
Max LT capital gains rate
20.00%
Distributor
Barclays Capital, Inc.
ISIN
US06748M1962
CUSIP
06748M196
FIGI
BBG00JQ5JWB5
Identifiers
ISIN US06748M1962
VXX is a known, liquid volatility ETP, and is one of a handful that offers short-term VIX futures exposure. As a VIX ETP investor, it is important to note these two caveats: 1) Volatility ETPs deliver poor long-term exposure to the VIX index, and 2) volatility ETPs have a history of erasing vast sums of investor capital over holdings periods as short as a few days. Still, short-term VIX ETPs like VXX tend to have a better statistical correlation and tactical exposure to the VIX than midterm product, but also tend to have position decay from contango in their futures positions. As an ETN, VXX is backed by Barclays credit rather than by assets. VXX launched under the ticker VXXB as Series B replacement for the original VXX. The old VXX was delisted January 2019, and in May 2019, VXXB took over the VXX ticker. The current VXX provides identical exposure as the old with some structural changes, including an issuer call capability, and a non-path-dependent fee structure.
Classification
The VXX is warning us that something is coming!This video is for my subscribers where we go over all the important charts and we also go over the other open positions that I have with you folks that I didn't have a chance to go over with you all. Micron beat earnings but is it enough to save this market? There are warning signs that are saying i
Update on our VXX chart!CBOE:VXX
In this video I go over as to why I added to my position today, essentially doubling down to really bring in our average nicely! I have room for one more add and if I need to and when I deploy it I will make another video. I would consider taking half off at our break even then let the r
I'm preparing for the pull back in the markets! Added to my VXXCBOE:VXX
The reason why i added in a technical biases is because we are at support of the falling wedge pattern and we kissed double bottom. Markets have just been grinding higher but not so drastically lately like before. In the video i go into more details as what this EFT tracks. In lames term
VXX shows signs smart money is buying protection.As i talk about in the video there is a lot of complacency in the markets as the mentality is that this market can never go down. I don't believe that and actually i think were close to a pull back in the markets. When we do get it it should be big and I'm planning to take full advantage of it with
buy volatilitymarkets offer possibilities to buy everything these days, even volatility, use those opportunities to your advantage and profit overproportionally of a broader stocks sell-off by buying VIX or slightly leveraged VXX by VXX being the rolling future contracts on VIX but available at most brokers
Trading the VIX – Part 2Trading the VIX – Part 2: VIX ETPs and Strategic Applications
In Part 1 of this series, we explored the structure of VIX Futures, focusing on the roll-down effect in a contango VIX futures curve—common in calm market conditions.
In Part 2, we turn our attention to VIX-related Exchange-Traded Produ
See all ideas
Summarizing what the indicators are suggesting.
Oscillators
Neutral
SellBuy
Strong sellStrong buy
Strong sellSellNeutralBuyStrong buy
Oscillators
Neutral
SellBuy
Strong sellStrong buy
Strong sellSellNeutralBuyStrong buy
Summary
Neutral
SellBuy
Strong sellStrong buy
Strong sellSellNeutralBuyStrong buy
Summary
Neutral
SellBuy
Strong sellStrong buy
Strong sellSellNeutralBuyStrong buy
Summary
Neutral
SellBuy
Strong sellStrong buy
Strong sellSellNeutralBuyStrong buy
Moving Averages
Neutral
SellBuy
Strong sellStrong buy
Strong sellSellNeutralBuyStrong buy
Moving Averages
Neutral
SellBuy
Strong sellStrong buy
Strong sellSellNeutralBuyStrong buy
Displays a symbol's price movements over previous years to identify recurring trends.
Frequently asked questions
An exchange-traded fund (ETF) is a collection of assets (stocks, bonds, commodities, etc.) that track an underlying index and can be bought on an exchange like individual stocks.
VXX trades at 18.52 USD today, its price has risen 0.75% in the past 24 hours. Track more dynamics on VXX price chart.
VXX net asset value is 18.01 today — it's fallen 23.21% over the past month. NAV represents the total value of the fund's assets less liabilities and serves as a gauge of the fund's performance.
VXX assets under management is 480.33 M USD. AUM is an important metric as it reflects the fund's size and can serve as a gauge of how successful the fund is in attracting investors, which, in its turn, can influence decision-making.
VXX price has fallen by −16.20% over the last month, and its yearly performance shows a −47.77% decrease. See more dynamics on VXX price chart.
NAV returns, another gauge of an ETF dynamics, have fallen by −23.21% over the last month, showed a −27.08% decrease in three-month performance and has decreased by −50.41% in a year.
VXX fund flows account for 28.16 M USD (1 year). Many traders use this metric to get insight into investors' sentiment and evaluate whether it's time to buy or sell the fund.
Since ETFs work like an individual stock, they can be bought and sold on exchanges (e.g. NASDAQ, NYSE, EURONEXT). As it happens with stocks, you need to select a brokerage to access trading. Explore our list of available brokers to find the one to help execute your strategies. Don't forget to do your research before getting to trading. Explore ETFs metrics in our ETF screener to find a reliable opportunity.
VXX expense ratio is 0.89%. It's an important metric for helping traders understand the fund's operating costs relative to assets and how expensive it would be to hold the fund.
No, VXX isn't leveraged, meaning it doesn't use borrowings or financial derivatives to magnify the performance of the underlying assets or index it follows.
In some ways, ETFs are safe investments, but in a broader sense, they're not safer than any other asset, so it's crucial to analyze a fund before investing. But if your research gives a vague answer, you can always refer to technical analysis.
Today, VXX technical analysis shows the sell rating and its 1-week rating is sell. Since market conditions are prone to changes, it's worth looking a bit further into the future — according to the 1-month rating VXX shows the sell signal. See more of VXX technicals for a more comprehensive analysis.
No, VXX doesn't pay dividends to its holders.
VXX trades at a premium (0.07%).
Premium/discount to NAV expresses the difference between the ETF’s price and its NAV value. A positive percentage indicates a premium, meaning the ETF trades at a higher price than the calculated NAV. Conversely, a negative percentage indicates a discount, suggesting the ETF trades at a lower price than NAV.
VXX shares are issued by Barclays PLC
VXX follows the S&P 500 VIX Short-Term Futures Index. ETFs usually track some benchmark seeking to replicate its performance and guide asset selection and objectives.
The fund started trading on Jan 19, 2018.
The fund's management style is passive, meaning it's aiming to replicate the performance of the underlying index by holding assets in the same proportions as the index. The goal is to match the index's returns.