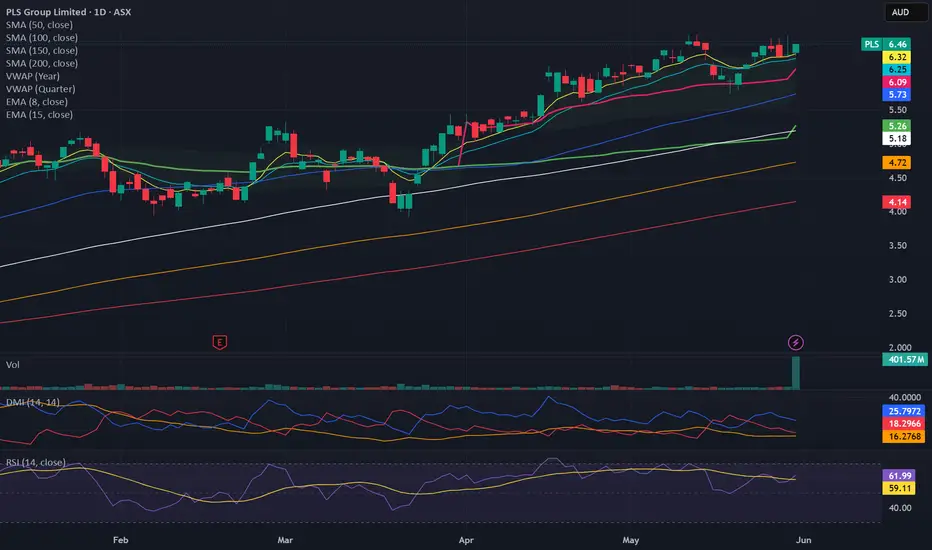
Bullish potential detected for PLSEntry conditions:
(i) higher share price for ASX:PLS along with swing up of indicators such as DMI/RSI.
Depending on risk tolerance, the stop loss for the trade would be:
(i) below the quarterly VWAP (currently $6.09), or
(ii) below the rising 50 day MA on the daily chart (currently $5.73).
PLS Group Limited
No trades
No trades
Compare with PLS Group Limited
0.16 AUD
525.76 M AUD
1.94 B AUD
3.12 B
Last report date
Aug 23, 2026
Report period
H2 2026
EPS
0.15 AUD
Revenue
1.31 B AUD
Company info
Sector
Industry
CEO
Dale Henderson
Website
Headquarters
West Perth
Founded
2005
IPO date
Sep 19, 2007
ISIN
AU000000PLS0
FIGI
BBG000RLN5X0
Identifiers
ISIN AU000000PLS0
PLS Group Ltd. engages in the provision of exploration and evaluation of mineral properties. It operates through the China and Other Foreign Countries geographical segments. It focuses on lithium and tantalum properties of Pilgangoora Lithium-Tantalum Project located in the Pilbara region. The company was founded on January 10, 2005 and is headquartered in West Perth, Australia.
ASX STOCKS SCAN: PLS - 27 AUG, 2025 - BULLISH POTENTIALConclusion: Wave v))green may be moving higher.
Key Points: Wave v))green is extended and subdivides into waves i,ii,iii)purple. Wave iii)purple may now be moving higher, targeting the nearest target at the high of 3.12. While price must remain above 2.07 to maintain this view.
Invalidation Point:
ASX:PLS - 13 AUG, 2025 - ELLIOTT WAVE ANALYSISConclusion: Short-term, wave 2-red is moving lower.
Key points: Wave 2)-blue has ended at 1.070 and wave 3)-blue is moving much higher. It is subdividing into wave 1-red, which has just completed. Wave 2-red is now probably unfolding to push lower, targeting a low around 1.710.
So short-term, this
Pilbara Mineral - Bull Flag CaseNot going to cover the commodity price...I get it. However I will cover what I see on the chart.
On the lead up to it's ATH, to me it painted several bull flags. Obvious argument to make in hindsight.
Currently I'm making the case for a massive bull flag. Yes that would require a change in sentiment
PLS,The Bull of Lithium Target $5PLS has been very strong keep going up after big drops, 5/10/20/60 MAs are Lining up below.
The trend is very strong like a Rocket. There are many investors who seeing the future of Lithium industry.
if you want to make good money, Come and join this ride on this amazing rocket!
Happy trading.^.^
RiskMastery's Red Flag Stocks - PLS EditionWelcome to RiskMastery's Red Flag Stocks - Stocks with bearish potential.
In this edition, we'll be looking at ASX:PLS ...
I believe this code is at a point of potential volatility.
If price can hold below $4.02 ... Bearish potential may be unlocked.
My key downside targets include:
-
PLS : Australian Lithium: Bullish: GARTLEY detectedPLS: Australian Lithium.
Let me remind you that Australia is the leading producer of Lithium in the world (50% of global extraction).
This “white gold” is mainly used in the manufacture of batteries for smartphones and electric vehicles (TESLA, Mercedes, etc.).
LAC lithium prices are currently very
H&S Pattern aftermarth + short termA head and shoulders pattern has formed between 24/07/2023 to 28/08/2023.
With a close above $4.44 on 28/08; we can expect some relief trading in the morning of 29/08/2023 to a potential $4.70 (where the second shoulder started to form) before trading to the downside in anticipation of ex-dividend
See all ideas
Summarizing what the indicators are suggesting.
Neutral
SellBuy
Strong sellStrong buy
Strong sellSellNeutralBuyStrong buy
Neutral
SellBuy
Strong sellStrong buy
Strong sellSellNeutralBuyStrong buy
Neutral
SellBuy
Strong sellStrong buy
Strong sellSellNeutralBuyStrong buy
An aggregate view of professional's ratings.
Neutral
SellBuy
Strong sellStrong buy
Strong sellSellNeutralBuyStrong buy
Neutral
SellBuy
Strong sellStrong buy
Strong sellSellNeutralBuyStrong buy
Neutral
SellBuy
Strong sellStrong buy
Strong sellSellNeutralBuyStrong buy
Displays a symbol's price movements over previous years to identify recurring trends.
Frequently asked questions
The current price of PLS is 5.09 AUD — it has decreased by −2.12% in the past 24 hours. Watch PLS Group Limited stock price performance more closely on the chart.
Depending on the exchange, the stock ticker may vary. For instance, on ASX exchange PLS Group Limited stocks are traded under the ticker PLS.
PLS stock has fallen by −2.12% compared to the previous week, the month change is a 15.42% rise, over the last year PLS Group Limited has showed a 120.35% increase.
We've gathered analysts' opinions on PLS Group Limited future price: according to them, PLS price has a max estimate of 7.00 AUD and a min estimate of 3.30 AUD. Watch PLS chart and read a more detailed PLS Group Limited stock forecast: see what analysts think of PLS Group Limited and suggest that you do with its stocks.
PLS stock is 5.48% volatile and has beta coefficient of 2.00. Track PLS Group Limited stock price on the chart and check out the list of the most volatile stocks — is PLS Group Limited there?
Today PLS Group Limited has the market capitalization of 16.42 B, it has increased by 3.63% over the last week.
Yes, you can track PLS Group Limited financials in yearly and quarterly reports right on TradingView.
PLS Group Limited is going to release the next earnings report on Feb 24, 2027. Keep track of upcoming events with our Earnings Calendar.
PLS earnings for the last half-year are 0.15 AUD per share, whereas the estimation was 0.17 AUD, resulting in a −8.57% surprise. The estimated earnings for the next half-year are 0.20 AUD per share. See more details about PLS Group Limited earnings.
PLS Group Limited revenue for the last half-year amounts to 1.31 B AUD, despite the estimated figure of 1.31 B AUD. In the next half-year revenue is expected to reach 1.61 B AUD.
PLS net income for the last half-year is 492.94 M AUD, while the previous report showed 32.82 M AUD of net income which accounts for 0.00% change. Track more PLS Group Limited financial stats to get the full picture.
Yes, PLS dividends are paid annually. The last dividend per share was 0.05 AUD. As of today, Dividend Yield (TTM)% is 0.00%. Tracking PLS Group Limited dividends might help you take more informed decisions.
As of Sep 6, 2026, the company has 1.18 K employees. See our rating of the largest employees — is PLS Group Limited on this list?
EBITDA measures a company's operating performance, its growth signifies an improvement in the efficiency of a company. PLS Group Limited EBITDA is 1.11 B AUD, and current EBITDA margin is 57.41%. See more stats in PLS Group Limited financial statements.
Like other stocks, PLS shares are traded on stock exchanges, e.g. Nasdaq, Nyse, Euronext, and the easiest way to buy them is through an online stock broker. To do this, you need to open an account and follow a broker's procedures, then start trading. You can trade PLS Group Limited stock right from TradingView charts — choose your broker and connect to your account.
Investing in stocks requires a comprehensive research: you should carefully study all the available data, e.g. company's financials, related news, and its technical analysis. So PLS Group Limited technincal analysis shows the buy rating today, and its 1 week rating is buy. Since market conditions are prone to changes, it's worth looking a bit further into the future — according to the 1 month rating PLS Group Limited stock shows the buy signal. See more of PLS Group Limited technicals for a more comprehensive analysis.