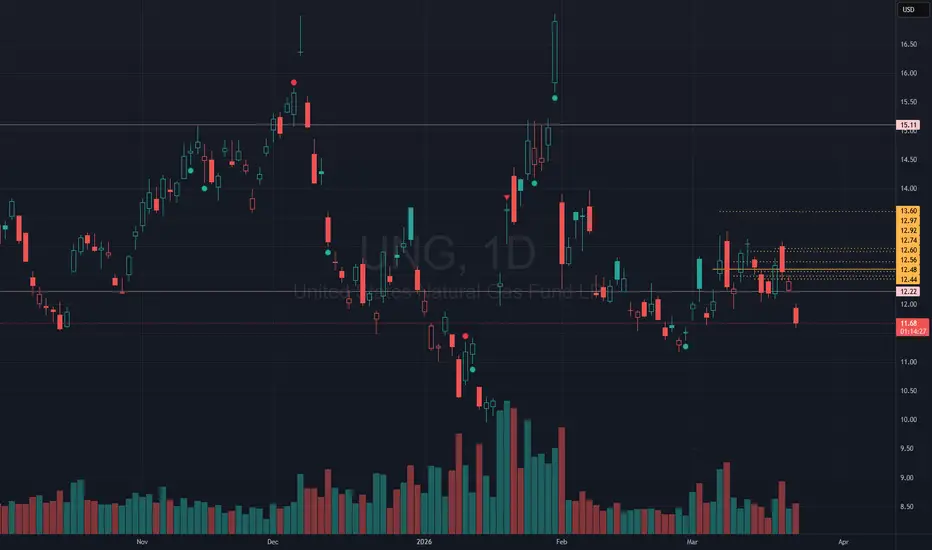
UNG | The time to go long has come- Timeframe: Weekly
- Trade type: Buy stop order
- Price: 10.69
- Take Profit: Open
- Stop Loss: 10.18 (-4.70 %)
Idea: Long on a breakout above last week's high - bullish momentum continuation.
Entry: Buy stop above last week’s high.
Stop-loss: Below the low of the same candle.
If the weekly candle closes below this level, the trade is invalidated.
Take Profit: Trailing stop following the lows of new weekly candles.
In-depth trading ideas
UNG | June, 2026 | The time to go long has come- Timeframe: Weekly
- Trade type: Buy stop order
- Price: 11.83
- Take Profit: Open
- Stop Loss: 11.21 (-5.20 %)
Idea: Long on a breakout above last week's high - bullish momentum continuation.
Entry: Buy stop above last week’s high.
Stop-loss: Below the low of the same candle.
If the weekly candle closes below this level, the trade is invalidated.
Take Profit: Trailing stop following the lows of new weekly candles.
UNG | "Power Plant Day" or Payday? Why UNG is Coiling | LONGIf you thought your wallet felt light after the holidays, buckle up. Natural gas is about to pull a "Phoenix" act, and it’s not just because the groundhog saw its shadow. Between a geopolitical powder keg in the Middle East and the ghost of winter storms past, the "buy the dip" crowd is about to look like geniuses - and everyone else is going to be wearing three sweaters indoors.
1. The "Strait" Jacket: The Trump Deadline
As of this morning, April 7, 2026, the market is holding its breath. President Trump has set a hard 8:00 PM ET deadline for Iran to reopen the Strait of Hormuz or face "decimation" of its energy infrastructure. After the joint US-Israel strikes on February 28, the "will they, won't they" drama has officially pivoted to "they did," and now we’re in the "what next?" phase.
The Math: Roughly 20% of the world’s LNG flows through that narrow strip of water. It’s currently blocked, and Trump is threatening to turn Iran’s power plants into expensive parking lots if the gates don't open tonight.
The Snark: If you thought your gas bill was high, wait until the "Strait" becomes a "Dead End." Analysts are predicting global LNG prices could quadruple. That’s not a "pop"—that’s a moon mission without a flight plan, fueled by a President who treats geopolitical deadlines like a season finale of The Apprentice.
2. "Winter Storm Fern" Left the Cupboard Bare
While Trump is bringing the heat to the Middle East, Winter Storm Fern already brought the cold to our inventories. Remember late January? While you were complaining about the slush, Fern was busy devouring the US natural gas supply.
The Record: We saw the largest weekly storage withdrawal in history (360 Bcf).
The Fallout: Despite the Trump administration’s "Energy Dominance" push to drill everywhere including your backyard, inventories are still struggling to recover from that historic drain. We’re basically running the heater on "E," and the EIA just hiked forecasts because we're one global supply disruption away from a real problem.
3. The Technical "Spring-Load": 3 Mini Bullish Wedges
From a swing trader's perspective, the chart for UNG (Natural Gas) is starting to look like a coiled rattlesnake.
The Triple Threat: We are currently seeing three mini bullish descending wedges forming on the 4-hour chart. For the uninitiated: that’s technical speak for "the sellers are exhausted and the buyers are hiding in the bushes with a net."
The MACD Divergence: The 3D MACD is curving up, flashing a classic divergence. While the "mild weather" crowd hammered prices down to the $2.80 - $3.20 range, the momentum is shifting.
The Gap: With Sunday's open already showing volume spikes, that $3.20 entry looks like a gift-wrapped souvenir from a simpler time.
The Verdict
The market was priced for a "boring" shoulder season. Instead, it got a geopolitical ultimatum and a technical triple-wedge setup. If you haven't looked at UNG or BOIL for a scalp, you're essentially betting that the Middle East will suddenly find its "zen" and Trump will miss a deadline.
Positioning for "The Divergence Seeker": We are watching the divergence between "peace-time pricing" and "war-time reality." If the 8 PM deadline passes without a deal, the "Buy" signal won't just be a bar on your TradingView chart - it’ll be a vertical line.
UNG | Rarely Wrong, but Heating Bills Will Pop Higher!If you thought your wallet felt light after the holidays, buckle up. Natural gas is about to pull a "Phoenix" act, and it’s not just because the groundhog saw its shadow. Between a geopolitical powder keg in the Middle East and the ghost of winter storms past, the "buy the dip" crowd is about to look like geniuses—and everyone else is going to be wearing three sweaters indoors.
1. The "Strait" Jacket: The Iran Factor
As of this weekend (February 28, 2026), the "will they, won't they" drama between the US/Israel and Iran has officially pivoted to "they did." With military strikes hitting Iranian infrastructure, the market is staring down the Strait of Hormuz like a kid staring at a broken glass jar.
The Math: Roughly 20% of the world’s LNG flows through that narrow strip of water.
The Snark: If Iran decides to park a few "peaceful" naval vessels in the middle of the lane, analysts are predicting global LNG prices could quadruple. That’s not a "pop"—that’s a moon mission without a flight plan.
2. "Winter Storm Fern" Left the Cupboard Bare
Remember late January? While you were probably complaining about the slush, Winter Storm Fern was busy devouring the US natural gas supply.
The Record: We saw the largest weekly storage withdrawal in history (360 Bcf).
The Fallout: US inventories are currently 8% below where they should be for late February. We’re basically running the heater on "E," and the EIA just hiked their March price forecast by 40% to account for the fact that we're one cold snap away from a real problem.
3. The Technical "Spring-Load"
From a swing trader's perspective, the setup is almost offensive:
The Gap: March futures got hammered down to the $3.20 range earlier this month on "mild weather" hopes.
The Reality: That low price didn't account for a regional war. Now, with the 3D MACD curving up and a massive volume spike expected at Sunday's open, that $3.20 looks like a gift-wrapped entry from 2024.
The Verdict
The market was priced for a "boring" end to winter. Instead, it got a geopolitical explosion and a storage deficit. If you haven't hedged your heating costs or looked at UNG/BOIL for a quick scalp, you're essentially betting that the Middle East will suddenly become a bastion of tranquility and the laws of supply and demand are merely suggestions.
Is Natural Gas a Buy? Natural Gas continues to remain very weak.
The trend before and during the war remains bearish.
Nat gas has had the perfect opportunity to rally with middle eastern tensions but it continues to fall.
Comparing it to crude oil, Natural Gas has fallen below all of its key daily & weekly moving averages.
We have a plethora of supply of Nat Gas and with the addition of Venezuela/ Trinidad Draganfield now being tapped, I believe this is offsetting supply constraints.
Nat gas is on the precipous of falling to new 52 week lows.
Will Natural Gas Keep Rallying? Nat Gas continues to flex it muscles through this cold front.
Demand has certainly increased and is likely going to stay firm into the Feb 8 week, as we get updated forecasts that are expected to warm up.
Resource stocks remain strong which should support Nat gas pushing a bit higher.
If Nat Gas pushes up another 10% we will be trading into an extreme 3 standard deviation move. This open up the probabilities of a sharp pullback.
UNG volume has been excessively high on recent weeks.
We have trimmed some of our resource stock longs... selling into strength but letting runners run.
SPY/QQQ Plan Your Trade For 1-28: Breaking(Up/Down)Today’s pattern is a Breaking(Up/Down) pattern.
This pattern suggests the SPY/QQQ will attempt to break away from yesterday’s price range. Normally, these Breaking patterns resolve as a moderately aggressive move away from the previous candle’s body range. Thus, my expectations are for the SPY/QQQ to attempt to move higher into the “new high” territory as we continue to work through the Flag Apex volatility phase.
Overall, I believe this move higher will stall out in early February and move downward as my Predictive Modeling has suggested. For many weeks, the Predictive Modeling tool has shown the markets will move into a potential breakdown phase in early/min February.
At this time, I believe the markets are pushing higher into a “false high” pattern that could translate into a larger breakdown phase moving through Q1:2026 and into Q2:2026. Time will tell.
As you know, I’ve moved my trades mostly to CASH and am currently sitting on about 70-80% CASH in my account. Yes, I still have some trades active and I have begun to setup 35+ day Shorts/Puts related to my expectation the markets may move downward in early February – but I’m not going to chase this move any further right now.
The one trade I believe I may make by the end of this week is to put on 1-3 longer-term Gold/Silver Calls. I believe this move in metals is unprecedented and I believe a small active position is almost essential. If you don’t play this once in a lifetime move efficiently, you can’t materialize the gains.
Right now, the hardest part of my trading is NOT wanting to get overly excited about these big runs in Metals and the potential for NatGas. I have to keep telling myself to be patient and wait for the right setups. Trust my analysis and trust my instinct.
There will always be another day to trade in the future.
At this point, I think the smartest move is to sit back and watch for a few days. This big move higher in Gold/Silver could be “the rally to the peak of Leg #2” – just like I predicted. One thing I’ve learned is not to chase moves when you believe they are over or nearly done.
Sure, you can leave a small runner position on if you want. Just be prepared for that position to turn into a loss if the markets suddenly turn against your trade.
NatGas rolled to the March contract. That is why we are seeing a big price gap on the NG chart. UNG is holding up well and I believe this storm will continue to increase demand into February – possibly into March. So, I plan on trying to take advantage of any price weakness in UNG.
If today goes as planned, it should be a day of mostly sitting and watching the markets. I don’t plan on being overly aggressive with my trades today.
Get some.
Trade Idea: UNG April 17th 2 x 11C/-14C Zebra*Here, looking to buy 2 x the April 75 delta calls and sell a -50 call against, with the resulting setup having a net delta of around 100 (i.e., the delta equivalent of 100 shares of stock). This is more buying power efficient than being in the stock, which is why I'm doing things this way.
As of today's close, the theoretical price of the setup is around a 4.62 debit, so will look to get filled in that neighborhood. I don't have a particular profit target in mind, but the local high was on 12/5 with a high of 17 ... .
Metrics:
Buying Power Effect/Max Loss: 4.62 ($462)
Max Profit: Infinite
Break Even: 13.30/share
* -- Zero Extrinsic Back Ratio.
Is Natural Gas Bottoming? Natural gas continues to remain at the lower end of support.
Intra day nat gas is potentially forming a bullish inverse heads and shoulder pattern.
As long as Nat gas keeps giving is some higher lows - we should see a near term pop to the upside.
Failure to break out in the coming sessions could send us to 2.75.
I remain net long nat gas at these levels.
United States Natural Gas Fund under pressure as selling acceleCurrent Price: 10.40
Direction: SHORT
Confidence level: 62%(Data quality is mixed, but price action and trader behavior tilt bearish)
Targets
Target 1: 10.05
Target 2: 9.70
Stop Levels
Stop 1: 10.95
Stop 2: 11.30
Wisdom of Professional Traders:
This analysis blends the collective perspective of professional traders with real-time market behavior. When I look across the trader commentary and technical breakdowns, the dominant theme is caution. Several traders covering natural gas point out failed rebounds, weak follow-through after bounces, and repeated selling pressure when price attempts to stabilize. The wisdom of professional traders here isn’t about bold upside calls, but about respecting momentum that continues to lean lower.
Key Insights:
Here’s what’s really driving this setup. United States Natural Gas Fund is sitting just above its recent lows after a sharp selloff, and the bounce attempts have been shallow. Multiple traders focusing on natural gas futures are highlighting oversupply concerns and mild weather forecasts cutting into demand. That combination keeps rallies capped and encourages short-term selling.
What caught my attention is how volume expanded on down days. That usually tells me traders are not panicking out at the bottom, but actively pressing shorts. At the same time, there’s a lack of strong dip-buying interest from the professional trading crowd. When traders don’t step in aggressively near support, downside often continues.
Recent Performance:
This all showed up clearly in recent price action. UNG dropped more than 7% in a single session and is down sharply over the past month. The fund is trading near its 52-week low zone, and while there was a brief intraday bounce, it failed to hold. That kind of price behavior suggests sellers remain in control going into the week.
Expert Analysis:
Looking at the charts traders are sharing, UNG is below short-term and medium-term moving averages, with momentum indicators still pointing down. Several traders highlighted the $11.00–$11.20 area as a key rejection zone, which aligns well with my stop placement. As long as price stays below that zone, the short bias makes sense.
There are a few longer-term bullish discussions floating around natural gas as a commodity, but those are not actionable for this week. Short-term traders are focused on what price is doing now, and right now it’s struggling to find firm footing.
News Impact:
On the news side, forecasts for milder winter conditions and steady production continue to weigh on natural gas prices. Inventory data hasn’t delivered the kind of bullish surprise that would force shorts to cover aggressively. Until there’s a clear shift in weather models or storage trends, news flow favors continued downside pressure.
Trading Recommendation:
Putting it all together, I favor a SHORT position on United States Natural Gas Fund for this week. The trend is down, rallies are being sold, and trader conviction on the upside is limited. I’d look to manage risk tightly, respecting the $10.95–$11.30 zone as invalidation. If downside momentum continues, the $10.05 level is the first realistic objective, with $9.70 as a stretch target if selling accelerates.
Opening (IRA): UNG April 17th 10C/January 16th -16C... for a 4.08 debit.
Comments: Seasonal natural gas play, buying the deep ITM, high delta long in April and selling the shorter-dated in January.
Metrics:
Buying Power Effect: 4.08 ($408)
Max Profit: 1.92 ($192)
ROC at Max: 47.06%
50% Max: .96
ROC at 50% Max: 23.53%
Will generally look to money/take/run at 50% max or look to roll out the short call to reduce my break even further.
Natural Gas - Epic Trade SetupNatural Gas made a new 52 week high today.
Inventory report came out and printed a smaller drawdown of 12BCF vs 18BCF expectation.
The initial reaction saw a bearish selloff all to be met with a bullish reversal to new highs.
Many traders closed out their shorts today as seen by the influx of volume across the sector.
Nat gas resource stocks saw some selling from the highs which could indicate some profit taking is occurring.
I'm looking for a short scalp setup in Nat gas tomorrow / next week.
UNG Bullish: Breakout Retest Toward 18Hello, traders! UNG has carved out a confirmed double bottom at $12.00 and reclaimed the 20/60-day MAs, with MACD and SQZMOM turning positive. Price is now pressing the long-term 120-day MA near $13.98—first real test of the new uptrend on the 1D chart. The neckline sits around $13.75, which flipped to support on the breakout and should be the battleground on any pullback.
Primary path: look for continuation if buyers can close the day above $14.75. That break-and-hold unlocks room toward $16.00, then $17.25, with the larger supply zone anchored near $18.00 from the May–June consolidation. Momentum is expanding, so shallow dips into $13.75 can be constructive as long as that level holds. The structural floor remains $12.00.
Alternative: if price gets rejected at the MA120 and slips back below $13.90, risk of a bull trap rises. A daily close under the neckline at $13.75 would invalidate the immediate bullish thesis and open a path back to $12.00. Invalidation for longs: daily close < $13.75. Trigger for continuation: daily close > $14.75. Targets: $16.00 → $17.25, with $18.00 as the higher-timeframe supply.
Thought of the Day 💡
Good trend trades start at levels where you’re least tempted to chase—and most prepared to invalidate.
This is a study, not financial advice. Manage risk and invalidations
Give It The Gas
I've got a long Idea for the Henry Hub Natural Gas ETF, UNG.
After rising in late-2024/early-2025, UNG fell again (Mar-Jun), but recently (significantly) crossed above the trendline from that down move.
Time to look for a long position. But UNG is volatile - to reduce risk it's best to pick it up after a minor pullback. That seems to be happening now.
One thing I find useful when looking at an ETF backed by a commodity is to look at the chart for the underlying commodity future.
To be clear, I am NOT trading the future, only looking to it for (more) guidance.
In this case, for UNG, I chose the Aug Henry Hub Natural Gas contract (NGQ2025), which TradingView provides 10-minute delayed date for;
Here we see the trendline (light blue) is even stronger (i.e., more points of contact). In addition, the contract made a series of slightly higher lows (yellow line) before breaking through strong resistance at ~3.82 (a level which may now be providing support). Trendline breaks alone can be very flighty - they often don't work - so it helps to have other supporting factors (e.g., higher lows preceding, strong resistance breaks). And, not shown here but useful, UNG/NG is not overbought on the daily chart.
Now one could take a long position here, with a stop below the trendline, but I prefer my knives to at least slow down before I catch them.
Looking at the 4-hour chart for a reversal to enter;
A reversal and close above 3.92 would give a good entry point (using UNG), with a tighter stop at ~3.7 (or ~16.25 on UNG).
This is a "work in progress", so the actual trigger levels may change a bit. Or the whole setup could invalidate itself if the instrument(s) corrects back to at/below the trendline.
For targets, natural gas has resistance at 19.1 and again at 24.0 - best to trail a stop as UNG's price rises, bringing it up as each zone is hit.
For the long position, I anticipate an ITM option ~90 days out. I'm doing this in a taxable account, and for tax purposes UNG issues a K-1 to shareholders. I can do without the hassle. Option holders do not receive K-1's* (unless assigned), making tax reporting more routine.
Time to step on the gas?
*To the best of my knowledge - if any tax experts here know otherwise please drop a comment.
My ideas here on TradingView are for educational purposes only. It is NOT trading advice. I often lose money and you would be a fool to follow me blindly.