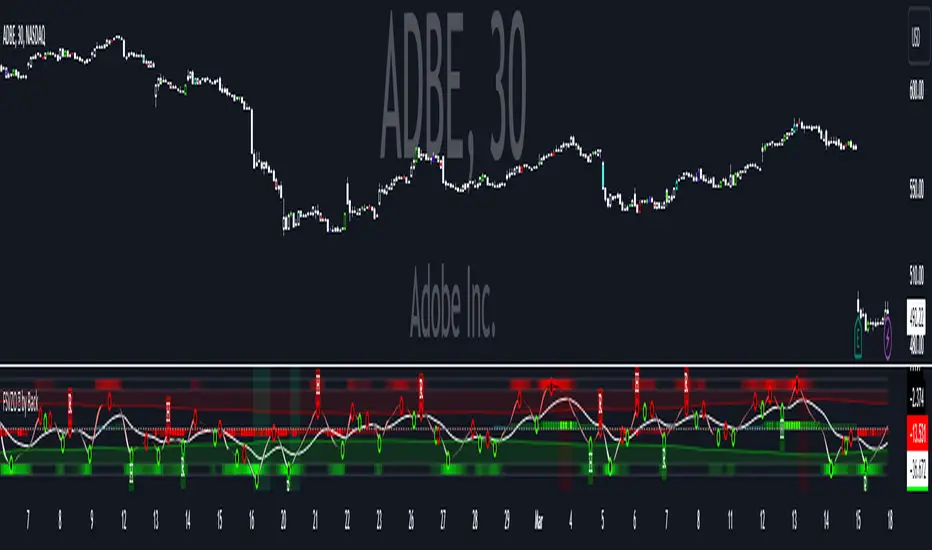
Fourier Adjusted Volume Zone Oscillator [BackQuant] Fourier Adjusted Volume Zone Oscillator
Welcome to BackQuant's FSVZO, Primarily we decided to combine the Fourier analysis to a leading indicator concept. Since in concept it can be beneficial.
We also decided to add in the momentum velocity indicator as a point of confluence.
Which will be discussed later in how it can be used in a trading system. For now onto the boring stuff, please read all of this and enjoy!
Fourier ? What and Why:
Fourier transforms are a mathematical technique used for transforming signals between time and frequency domains. In the context of financial markets, this allows analysts to deconstruct price movements into constituent sinusoidal waves. By isolating these waves, traders can identify the dominant market cycles and trends hidden within the 'noise' of short-term price fluctuations.
Empirical Evidence and Benefits:
Cycle Identification: Empirical studies have shown that markets exhibit cyclical behaviors due to various economic, geopolitical, and psychological factors. Fourier filtering helps in pinpointing these cycles, even in seemingly random market movements.
Trend Detection: By highlighting dominant frequencies, traders can more accurately determine the prevailing trend direction, aiding in trend-following or contrarian strategies.
Volatility Clarity: Filtering out noise enhances the visibility of true market volatility, crucial for risk management and strategy adjustment.
Why the Volume Zone Oscillator (VZO) and Origins + Advantages:
The VZO was developed by Walid Khalil and David Steckler and introduced in the "Stocks & Commodities" magazine in 2009. It integrates volume with price movements to gauge the flow of buying and selling pressure. Unlike traditional volume indicators that solely quantify trading volume, the VZO interprets volume's impact on price direction, offering insights into the strength or weakness of a price trend.
Empirical Evidence and Benefits:
Market Sentiment: Volume is a key indicator of market sentiment. High volume accompanying price movements indicates strong sentiment, whereas low volume suggests a lack of conviction. The VZO makes this analysis quantifiable.
Overbought/Oversold Conditions: By quantifying where the current volume-weighted price is within its range, the VZO helps identify potential reversals, providing actionable signals for entering or exiting trades.
Trend Confirmation: The VZO's ability to confirm price trends with volume adds an extra layer of validation to trading signals, reducing the likelihood of false breakouts or breakdowns.
Why we Decided to Combine Them
The integration of Fourier filtering with the VZO offers a comprehensive view of the market by combining the geometric clarity of price movements with the psychological insights provided by volume analysis. This synergy allows for a more nuanced understanding of market dynamics.
Enhanced Signal Accuracy: The combination reduces the chances of false signals. Fourier filtering's trend and cycle identification, combined with the VZO's volume-based confirmation, can significantly enhance trading decision accuracy.
Market Turns and Continuations: Fourier analysis can indicate potential turning points or continuation patterns, which, when confirmed with volume analysis through the VZO, provides a robust signal for traders to act upon.
Adaptability: Both tools adapt well to various market conditions, making this combination versatile across different trading instruments and timeframes.
Empirical Evidence:
While specific empirical studies directly analyzing the combined effectiveness of Fourier filtering and VZO might be scarce, the foundational research supporting each method individually provides strong evidence of their validity. Academic and practical applications in financial markets have demonstrated the value of both Fourier analysis for cycle detection and volume-based oscillators like the VZO for assessing market strength and sentiment. Together, they offer a compelling toolkit for traders aiming to refine their market analysis and strategy execution.
USER INPUTS
Momentum Velocity Group
Show Confluence Momentum Velocity?: This toggle allows users to decide whether they want to display the momentum velocity indicator on their chart. It's designed to show the momentum of price movements, potentially indicating acceleration or deceleration in price trends.
Calculation Source: This setting lets users select the price data used for calculating the momentum velocity. Common options include the close, open, high, low, or an average of these prices. The choice depends on what aspect of price action the trader wishes to analyze.
Lookback Period: Determines the number of bars used to calculate the momentum. A longer period may smooth out the indicator, reducing sensitivity to recent price changes, while a shorter period may make the indicator more responsive to new information.
Use Adaptive Filtering?: Enables the use of adaptive filtering for the momentum calculation. This feature adjusts the indicator's sensitivity based on recent market volatility, potentially improving the indicator's responsiveness to market changes.
Adaptive Lookback Period: Specifies the period for the adaptive filter. This setting fine-tunes how rapidly the filter adjusts to changes in market conditions.
FSVZO Group
Show FSVZO?: This input controls whether the Fourier Smoothed Volume Zone Oscillator is displayed on the chart. It's the main feature of the script, combining Fourier analysis with volume data to provide insights into market dynamics.
Calculation Source for FSVZO: Similar to the momentum velocity calculation source, this setting allows users to choose the price data (close, open, high, low, or an average) that will be used for FSVZO calculations.
Calculation Period: Defines the length of the window for Fourier analysis and VZO calculation. This period can affect the sensitivity and smoothing of the indicator.
Show FSVZO Band Filler? (Ribbon): When enabled, this feature displays a filled area or ribbon on the chart, making it easier to visualize the oscillator's movement and trends.
Show FSVZO Moving Average (Ema)?: This toggle allows the display of an Exponential Moving Average (EMA) of the FSVZO, which can help smooth out its movements and provide a clearer trend direction.
MA Period: Specifies the length of the moving average applied to the FSVZO. Adjusting this period can affect the smoothness and lag of the trend indication.
Smooth VZO (Reduces noise, but increases its accuracy): Enables smoothing of the Volume Zone Oscillator to reduce noise and potentially increase the accuracy of its signals.
Smooth Period: Defines the smoothing period for the VZO, affecting how much noise reduction is applied.
UI Settings Group
Show Static Overbought and Oversold Levels?: Enables the display of predetermined levels that indicate overbought or oversold conditions, helping traders identify potential reversal points.
Show Adaptive Levels?: Allows the use of dynamic, market-condition-adjusted levels for overbought and oversold indicators, offering a more nuanced view of market extremes.
Show Detected Trend Shifts?: This setting controls the display of markers or indications when the script detects potential shifts in market trends, based on the oscillator's movements.
Trendshift Shader?: When enabled, this feature visually highlights areas on the chart where trend shifts are detected, improving the visibility of these important signals.
DIVERGENCES Group
Show Detected Divergences?: This option toggles the display of divergences between price action and the oscillator, which can signal potential reversals.
Use extra filtering when detecting divergences?: Enables additional criteria for identifying divergences, potentially improving the reliability of these signals.
Paint bars when Divergences are detected?: This feature changes the color of price bars when divergences are identified, making them stand out on the chart.
How to calculate divergences: Allows users to choose the method for calculating divergences, affecting the sensitivity and types of divergences that are identified.
Only calculate divergences on values absolutely greater than this: Sets a threshold for divergence calculation, focusing on more significant divergences and reducing noise.
Each input is designed to offer flexibility and control to the user, enabling a highly customizable experience tailored to individual trading strategies and market conditions.
How Can it Be Used in a Trading System
There are a few key ways it can be used, the main way is going to be the trend of the band/ ribbon. As that denotes the primary trend. Thus, if it were to trend up and reach the static overbought zone, there is a high probability of a reversion. This will also work well when it is in an extreme zone and there is a divergence.
Other ways of using it, it taking profit when there is an extreme background hue. Or potentially starting to get ready to buy on a higher timeframe if there is a extreme oversold background hue.
For more clear trends out of the FSVZO you may choose to use the moving average crossing the midline in confluence with the momentum velocity.
Please use with caution, nothing BackQuant or associated entities do are financial advice. please do not use this or any other indicator alone, they are not meant to be used in isolation.
Thus following all of the key points here are some sample backtests on the 1D Chart
Disclaimer: Backtests are based off past results, and are not indicative of the future.
This is using the Midline Crossover of the FSVZO:
INDEX:BTCUSD
INDEX:ETHUSD
BINANCE:SOLUSD
BBPct FL Impulse [BackQuant] BBPct FL Impulse
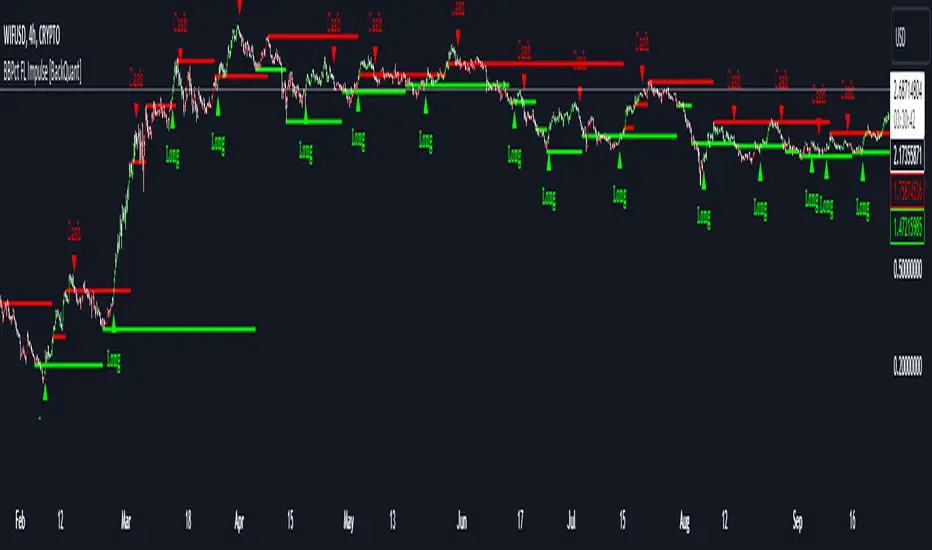
Introducing BackQuant's BBPct FL Impulse — a powerful and unique trading indicator designed to detect impulse moves and exhaustion points in the market. This leading indicator combines Bollinger Band Percentage (BBPct) calculations with a for-loop system to generate clear long and short signals. Additionally, it plots support and resistance exhaustion levels directly on the chart, providing traders with a visual representation of key market levels.
The BBPct FL Impulse is designed for traders who want to anticipate price movements rather than react to lagging indicators. By utilizing the Bollinger Band Percentage, this indicator identifies moments when the price is pushing toward extremes, signaling the likelihood of impulse moves. It goes a step further by providing exhaustion levels where the market may reverse or pause, helping traders identify potential entries and exits.
Core Concept: Bollinger Band Percentage (BBPct)
The BBPct is the primary calculation driving this indicator. It measures where the price is relative to its Bollinger Bands, allowing traders to gauge overbought or oversold conditions. Bollinger Bands are a well-known tool used to define high and low points based on standard deviation from a moving average. The BBPct takes this one step further by showing how far the price is within the bands, as a percentage.
In this script, the BBPct is calculated using the closing price over a customizable BBPct Length (default set to 70) and a Multiplier that defines the width of the bands based on standard deviation. This helps detect when price pushes toward its upper or lower boundaries, indicating potential breakouts or pullbacks.
For-Loop Scoring Mechanism
The for-loop scoring system adds a layer of sophistication to this indicator. It evaluates the BBPct over a range of periods (defined by the Start and End parameters) and generates a score that measures the direction and strength of the price movement.
Long Signals: A long signal is triggered when the score surpasses the Long Threshold (default set at 40), indicating a strong bullish impulse.
Short Signals: A short signal (labeled as "Cash" in this script) is triggered when the score crosses under the Short Threshold (default set at -10), suggesting the price has lost momentum and a bearish move may be coming.
These signals are highlighted on the chart with green triangles for Long and red triangles for Cash, giving traders clear visual cues for potential buy and sell points.
Key Feature: Exhaustion Levels (Support and Resistance)
One of the standout features of this script is the automatic plotting of Exhaustion Support and Resistance Levels. These levels represent points in the market where the price is likely to exhaust its movement and potentially reverse.
Support is plotted when the price shows signs of bullish exhaustion (low price points).
Resistance is plotted when the price shows signs of bearish exhaustion (high price points).
This dynamic support and resistance system uses a custom function based on price swings, analyzing exhaustion patterns to detect significant levels. The indicator allows traders to visualize key market zones where potential reversals or slowdowns may occur, helping to refine trade entries and exits.
Customization & Visualization
This indicator comes with a range of customizable settings, giving traders full control over how the signals are generated and displayed on the chart:
Calculation Source: Choose the price data used for the BBPct calculation (default is the closing price).
BBPct Length: Set the lookback period for the BBPct calculation, adjusting how smooth or reactive the indicator is to price changes.
Multiplier: Adjust the multiplier for the Bollinger Band calculation, controlling how wide or narrow the bands are and thereby affecting sensitivity.
Thresholds for Signals: Customize the thresholds for long and short signals, allowing you to fine-tune the sensitivity to different market conditions.
Show Long and Cash Signals: Toggle the display of long and short signals on the chart.
Exhaustion Levels: Toggle the display of support and resistance levels, adjusting the length of swings and the thickness of the lines to suit your preferences.
Trading Applications
The BBPct FL Impulse indicator is a versatile tool designed to help traders identify impulse moves and exhaustion points. Some of its key applications include:
Breakout Trading: By using the BBPct to detect when price moves toward the extremes of the Bollinger Bands, traders can anticipate potential breakouts and catch the beginning of strong price moves.
Reversal Trading: The exhaustion support and resistance levels provide key areas where price may reverse, allowing reversal traders to identify potential entries as the market shows signs of exhaustion.
Trend Following: The for-loop scoring system helps quantify the strength of price moves, enabling trend-following traders to stay in winning trades as long as the impulse remains strong.
Risk Management: By providing clear support and resistance levels, the indicator helps traders manage risk more effectively by highlighting zones where price may pause or reverse, allowing for better stop-loss placement.
Final Thoughts
The BBPct FL Impulse is an advanced indicator that combines the precision of Bollinger Band Percentage calculations with the power of a for-loop scoring system and dynamic exhaustion levels. Whether you're looking to trade breakouts, reversals, or trends, this indicator offers the tools to help you make informed decisions in the market.
As always, it's important to backtest the indicator and adapt it to your specific trading style and market. No indicator is infallible, and it should be used as part of a broader trading strategy that includes sound risk management practices.
DM Impulse Enhanced [BackQuant] DM Impulse Enhanced
What this is (and what it isn’t)
DM Impulse Enhanced is a signal-driven overlay that classifies market action into two practical regimes: Long (risk-on) and Cash (risk-off). It’s built around a proprietary impulse model from the directional-movement family, wrapped in a persistence test and a state machine. Because this script is private, the core mechanics are intentionally abstracted here; what follows explains how to read and use it without revealing the protected calculation.
Why traders use it
Many tools oscillate or describe “how stretched” price is; fewer make a firm, operational call that you can automate. DM Impulse Enhanced aims to do exactly that declare when upside pressure is broad and durable enough to justify a long bias, and when deterioration is strong enough to stand aside (cash/short discretion). The emphasis is on impulse persistence rather than one-off spikes.
What you see on the chart
• Long / Cash markers – Green up-triangles (Long) and red down-triangles (Cash) plot at the bar where the regime changes.
• Regime-tinted bars (optional) – Candles can be softly shaded green during Long and red during Cash for at-a-glance context.
• Trend ribbon (context only) – A narrow ribbon (fast/slow moving averages) is tinted by the current regime to show trend alignment; it does not generate signals on its own.
• No separate sub-pane – Signals are intended to sit directly on price for immediate decision-making.
How the logic behaves (high-level)
Impulse core – A directional-movement–based engine estimates the strength of buying vs. selling pressure over a user-defined horizon.
Persistence gate – Instead of reacting to a single reading, the model evaluates how consistently that impulse dominates across a configurable lookback range.
State machine – When persistence clears (or fails) a pair of thresholds, the model flips and stays in that regime until evidence justifies a change. This “stickiness” is intentional; it reduces whipsaws in choppy tape.
Inputs & controls
Calculation Settings
• DM Length – The base horizon for the impulse engine. Longer = smoother/steadier; shorter = quicker/more reactive.
• Start / End – Defines the span of the persistence check. Expanding the span asks the market to prove itself against more history before changing regime.
Signal Settings
• Long Threshold – The persistence level required to promote the model into Long.
• Short Threshold – The level that, once crossed to the downside, demotes the model into Cash. Using a cross-under event for risk-off helps avoid premature exits on noise.
Visual Settings
• Long / Short colours – Customize marker and shading hues.
• Color Bars? – Toggle candle tinting by regime (off if you prefer a clean chart).
Reading the signals
• Long prints only when the model observes sustained upside pressure across the configured span. Treat this as permission to engage with pullbacks, breakouts, or your preferred setups in the direction of the trend.
• Cash prints when downside deterioration is strong enough to invalidate the prior regime. It’s a risk-off directive—flatten, hedge, or switch to short strategies according to your plan.
• Regime persistence is a feature: once Long, the model won’t flip on minor dips; once Cash, it won’t re-arm on minor bounces. If you want more flips, shorten the spans and relax thresholds; if you want fewer, do the opposite.
Practical tuning guide
Match DM Length to your timeframe
– Intraday: smaller length for timely response.
– Swing/Position: larger length to filter desk-noise and track higher-timeframe flows.
Size the persistence span to your goal
– Narrow span: faster regime changes, more trades, more noise.
– Wide span: fewer, higher-conviction calls, longer holds.
Set realistic thresholds
– The Long threshold should be reachable with your chosen span; the Short threshold should be low enough to catch genuine deterioration but not so tight that it flips on every dip.
Decide on cosmetics
– Turn on bar tinting for discretionary reading, or keep it off when exporting screenshots or running other overlays.
Suggested workflows
• Trend-following with discipline – Trade only in the Long regime; use structure (higher lows, anchored VWAP, or pullbacks to your MA stack) for entries and the Cash flip as a portfolio-level exit.
• Risk overlay – Keep your normal strategy, but: reduce size when Cash appears; re-enable full risk only after Long reasserts.
• Multi-timeframe gating – Require Long on a higher timeframe (e.g., 4H or 1D), then take entries on a lower one. If the high-TF posts Cash, stand down.
How the ribbon fits in
The ribbon visualizes short- vs. intermediate-term trend in the same colour as the regime. It’s deliberately “dumb”: it does not change the signal, it just helps you see when price action and regime are in harmony (e.g., pullbacks during Long that hold above the ribbon).
Alerts included
• DM Impulse LONG – Triggers as the persistence measure clears the Long threshold.
• DM Impulse CASH – Triggers when deterioration crosses the Short threshold from above.
Configure alerts to fire on bar close if you want final (non-intrabar) decisions.
Strengths
• Actionable binary output – Long/Cash is unambiguous and easy to automate.
• Persistence-aware – Focuses on runs that endure, not one-bar excitement.
• Asset/timeframe agnostic – Works anywhere you trust directional-movement concepts (equities, futures, crypto, FX).
Limitations & cautions
• Not a reversal caller – It’s a regime classifier. If you need early bottoms/tops, pair it with your own exhaustion or liquidity tools.
• Parameter feasibility matters – If your thresholds are set beyond what your span can reasonably achieve, signals may rarely (or never) trigger.
• Chop happens – In mean-reverting or news-driven tape, expect more frequent flips unless you widen spans and thresholds.
• Intrabar movement – Like any responsive model, provisional intrabar states can appear before the bar closes. Use “bar close” alerts for finality.
Getting started (safe defaults you can adapt)
• Intraday bias – Shorter DM Length, modest span, moderately tight thresholds.
• Swing filter – Longer DM Length, wider span, stricter Long and sufficiently low Short.
• Conservative overlay – Keep thresholds firm and spans wide; use signals to scale risk rather than flip directions frequently.
Summary
DM Impulse Enhanced is a persistence-focused regime classifier built on directional-movement concepts. It answers a narrow question clearly “Risk-on or risk-off?” and stays with that answer until the evidence meaningfully changes. Use it as a bias switch, a portfolio risk overlay, or a gate for your existing entry logic, and size its spans/thresholds to the cadence of the market you trade. Oscillator Suite [BackQuant] Oscillator Suite
Oscillator Suite is built for one job: turn live market noise into a readable sequence of conditions.
Not “one signal.” Not “one oscillator.” A coordinated set of modules that track momentum , money pressure , and agreement between them so you can see when moves have real backing, when they are fading, and when reversal conditions are worth treating as a serious event.
Why this suite feels different in live markets
This suite is designed to show the why behind the candle :
Is the move being driven or just drifting ?
Is participation accumulating or exiting ?
Are your components telling the same story , or is the market split?
When a reversal appears, is it a real shift in conditions or a random wiggle ?
The goal is simple: when components converge, you get higher clarity. When they diverge, you get a warning before price makes it obvious.
How to read the suite in order
If you want the indicator to feel “alive” instead of confusing, use this order of operations:
Money Flow for pressure and participation
Momentum Ribbon for direction and shift timing
Confluence to measure agreement and regime quality
Reversals to mark turning points inside those regimes
Divergences for early “engine weakness” warnings
Bar Coloring to project the whole read onto price
Money Flow (pressure, accumulation, and the “truth layer”)
The Money Flow wave is your context filter. It exists to separate:
A push that has real buy-side pressure behind it
A move that looks bullish but has weak participation
A selloff that is heavy distribution
A dip where selling is running out of fuel
This is where the suite becomes practical. You can watch money flow transition from heavy selling to stabilization and then to early accumulation. Those transitions are where many of the best trades are born because the crowd is still reacting to the last move while conditions are already shifting.
Money Flow showing strong accumulation behavior:
Momentum Ribbon (the timing engine)
Momentum Ribbon is designed to lead. It is your “timing layer” that reads the market’s directional energy and highlights meaningful shifts.
The ribbon changes character when momentum strength changes, not after the fact.
The signal line smoothing lets you choose how sharp or how filtered your momentum read should be.
Crossover/crossunder events are emphasized so you can spot momentum flips without hunting.
In live markets, this is what you watch when price is chopping. The ribbon will often show when momentum is actually resolving even if price looks messy for a few candles.
Momentum Ribbon with longer-term momentum alignment influence:
Confluence Zones (regimes, not random signals)
Confluence zones are the difference between “I saw a signal” and “I saw conditions.”
They highlight when Momentum and Money Flow are aligned and when they are fighting each other.
Bullish confluence means momentum is constructive and pressure supports it.
Bearish confluence means momentum is bearish and selling pressure supports it.
Mixed conditions mean you should expect chop, fakeouts, and low follow-through unless a transition is underway.
This is how you stop forcing trades. When confluence is strong, you can hold with more confidence. When confluence fades, you tighten expectations and demand better structure or confirmation.
Reversal Signals (turning points that matter when the environment agrees)
Reversal signals are not meant to be blind buy/sell commands. They are “pay attention” events designed to become high value when stacked with the suite’s context.
You will see two main behaviors:
“ℝ” labels marking stronger reversal events near the extreme bands
Cross markers that can appear more frequently to highlight earlier swing warnings
Here’s the live-market mindset:
A reversal print during heavy opposing pressure is often just a pause.
A reversal print when money flow pressure is weakening or shifting is a different animal.
A reversal print as confluence transitions is where dips and tops become actionable ideas rather than guesses.
Strong reversal examples:
Reversals used to catch dips and sell strong turns:
Divergences (selective, threshold-based, and meant to reduce noise)
Divergences in this suite are designed to appear when momentum is meaningfully extended, so you’re not flooded with low-quality divergence spam in the middle of ranges.
What divergence is used for here:
Spot “engine weakness” when price attempts to extend but momentum does not match.
Warn you early so you can manage risk before the obvious reversal candle shows up.
Help you identify when a trend is losing quality, especially when confluence begins fading.
This becomes especially powerful when you treat divergence as step one, then look for step two:
Momentum ribbon begins to shift
Money flow pressure eases or flips
Confluence transitions
A reversal marker appears at a meaningful location
Momentum Velocity (longer-term push vs pull insight)
Momentum Velocity adds a second momentum lens that is slower and more “structural.” It helps you see whether the broader momentum environment is supporting what the ribbon is doing.
How traders use this in practice:
As a “permission layer” to avoid fighting stronger background pressure.
To confirm when momentum shifts are likely to hold, not just flip for a bar.
To spot when short-term momentum is turning inside a larger supportive environment.
Momentum Ribbon leading with added longer-term momentum confluence:
Bar Coloring (put the suite onto price)
Bar coloring exists for one reason: speed. It projects the suite’s current read directly onto candles so you can process conditions without staring at the panel nonstop.
Modes include:
Momentum direction
Momentum above/below midline
MFI above/below midline
Confluence (Momentum + Money Flow)
Strong Confluence Only
Momentum Velocity
Strong confluence coloring can help you stop taking trades in mixed conditions and focus on the regimes that actually trend or mean-revert with quality.
Multiple bar coloring methods:
Practical playbooks
1) Trend participation without chasing
Start with confluence. Only get aggressive when the suite shows agreement.
Use the ribbon to time entries on momentum shifts instead of random candles.
Use money flow to confirm that the trend has real pressure behind it.
When confluence fades, manage tighter. That is where follow-through weakens.
2) Dip catching that is not blind
Let price pull back while you watch money flow pressure.
If selling pressure is still heavy, you are early. If it is easing, you are getting close.
When a reversal appears, check whether momentum is stabilizing or flipping.
Best dips often show up during a confluence transition, not when everything is still bearish.
3) Selling tops without guessing
Watch for momentum weakening while price tries to extend.
Divergence becomes your first warning when conditions are stretched.
If confluence fades and money flow begins shifting, reversal signals become high-interest events.
This sequence is how you catch “strong reversals,” not random pullbacks.
Settings that matter (what to tune and why)
Momentum Calculation Period
Lower: faster, more reactive, more signals
Higher: smoother, fewer signals, cleaner regimes
Signal Line Type + Smoothing
More smoothing: cleaner shifts, less noise
Less smoothing: earlier shifts, more activity
MFI Calculation + Smoothing
Lower: faster pressure read
Higher: clearer accumulation/distribution structure
Divergence Threshold
Lower: more divergence events (shorter-term)
Higher: fewer events (more selective, longer-term)
Reversal Factor
Lower: more reversal events
Higher: fewer, stronger events through heavier filtering
How to know you are reading it right
When you get comfortable, you will start noticing the suite produces “states,” not random prints:
State: strong bullish agreement -> momentum drives, pressure supports, candles align.
State: bullish but weakening -> momentum begins fading, pressure cools, divergence may warn.
State: mixed -> more fakeouts, fewer clean runs, demand stronger confirmation.
State: transition -> this is where the best reversals and dip catches often appear.
State: strong bearish agreement -> downside pressure is real, short-side regimes behave cleaner.
If you trade based on states instead of isolated signals, the suite stops being “an indicator” and becomes a live market interpreter.
Risk disclaimer
Trading involves risk. This tool provides informational signals and visual context. Always confirm with structure/levels and use proper risk management. Long-Term Trend & Valuation Model [Backquant] Long-Term Trend & Valuation Model
Invite-only. A universal long-term valuation strategy and trend model built to work across markets, with an emphasis on crypto where cycles and volatility are large. Intended primarily for the 1D timeframe. Inputs should be adjusted per asset to reflect its structure and volatility.
If you would like to checkout the simplified and open source valuation, check out:
What this is
A two-layer framework that answers two different questions.
• The Valuation Engine asks “how extended is price relative to its own long-term regime” and outputs a centered oscillator that moves positive in supportive conditions and negative in deteriorating conditions.
• The Trend Model asks “is the market actually trending in a sustained direction” and converts several independent subsystems into a single composite score.
The combination lets you separate “where we are in the cycle” from “what to do about it” so allocation and timing can be handled with fewer conflicts.
Design philosophy
Crypto and many risk assets move in multi-month expansions and contractions. Short tools flip often and can be misleading near regime boundaries. This model favors slower, high-confidence information, then summarizes it in simple visuals and alerts. It is not trying to catch every swing. It is built to help you participate in the meat of long uptrends, de-risk during deteriorations, and identify stretched conditions that deserve caution or patience.
Valuation Engine, high level
The Valuation Engine blends several slow signals into one measure. Exact transforms, windows, and weights are private, but the categories below describe the intent. Each input is standardized so unlike units can be combined without one dominating.
Momentum quality — favors persistent, orderly advances over erratic spikes. Helps distinguish trend continuation from noise.
Mean-reversion pressure — detects when price is far from a long anchor or when oscillators are pulling back toward equilibrium.
Risk-adjusted return — long-window reward to variability. Encourages time in market when advances are efficient rather than merely fast.
Volume imbalance — summarizes whether activity is expanding with advances or with declines, using a slow envelope to avoid day-to-day churn.
Trend distance — expresses how stretched price is from a structural baseline rather than from a short moving average.
Price normalization — a long z-score of price to keep extremes comparable across cycles and symbols.
How the Valuation Engine is shaped
Standardization — components are put on comparable scales over long windows.
Composite blend — standardized parts are combined into one reading with protective weighting. No single family can override the rest on its own.
Smoothing — optional moving average smoothing to reduce whipsaw around zero or around the bands.
Bounded scaling — the composite is compressed into a stable, interpretable range so the mid zone and extremes are visually consistent. This reduces the effect of outliers without hiding genuine stress.
Volatility-aware re-expansion — after compression, the series is allowed to swing wider in high-volatility regimes so “overbought” and “oversold” remain meaningful when conditions change.
Thresholds — fixed OB/OS levels or dynamic bands that float with recent dispersion. Dynamic bands use k times a rolling standard deviation. Fixed bands are simple and comparable across charts.
How to read the Valuation Oscillator
Above zero suggests a supportive backdrop. Rising and positive often aligns with uptrends that are gaining participation.
Below zero suggests deterioration or risk aversion. Falling and negative often aligns with distribution or with trend exhaustion.
Touches of the upper band show stretch on the optimistic side. Repeated tags without breakdown often occur late in cycles, especially in crypto.
Touches of the lower band show stretch on the pessimistic side. They are common in washouts and early bases.
Visual elements
Valuation Oscillator — colored by sign for instant context.
OB/OS guides — fixed or dynamic bands.
Background and bar colors — optional, tied to the sign of valuation for quick scans.
Summary table — optional, shows the standardized contribution of the major categories and the final composite score with a simple status icon.
Trend Model, composite scoring
The trend side aggregates several independent subsystems. Each subsystem issues a vote: long, short, or neutral. Votes are averaged into a composite score. The exact logic of each subsystem is intentionally abstracted. The families below describe roles, not formulas.
Long-horizon price state — checks where price sits relative to multiple structural baselines and whether those baselines are aligned.
Macro regime checks — favors sustained risk-on behavior and penalizes persistent deterioration in breadth or volatility structure.
Ultimate confirmation — a conservative filter that only votes when directional evidence is persistent.
Minimalist sanity checks — keep the model responsive to obvious extremes and prevent “stuck neutral” states.
Higher timeframe or overlay inputs — optional votes that consider slower contexts or relative strength to stabilize borderline periods.
You define two cutoffs for the composite: above the long threshold the state is Long , below the short threshold the state is Short , in between is Cash/Neutral . The script paints a signal line on price for an at-a-glance view and provides alerts when the composite crosses your thresholds.
How it can be used
Cycle framing in crypto — use deep negative valuation as accumulation context, then look for the composite trend to move through your long threshold. Late in cycles, extended positive valuation with weakening composite votes is a caution cue for de-risking or tighter management.
Regime-based allocation — increase risk or loosen take-profits when the composite is firmly Long and valuation is rising. Decrease risk or rotate to stable holdings when the composite is Short and valuation is falling.
Signal gating — run shorter-term entry systems only in the direction of the composite. This reduces counter-trend trades and improves holding discipline during strong uptrends.
Sizing overlay — scale position sizes by the magnitude of the valuation reading. Smaller sizes near the upper band during aging advances, larger sizes near zero after strong resets.
DCA context — for long-only accumulation, schedule heavier adds when valuation is negative and stabilizing, then lighten or pause adds when valuation is very positive and flattening.
Cross-asset rotation — compare symbols on 1D with the same fixed bands. Favor assets with positive valuation that are also in a Long composite state.
Interpreting common patterns
Early build-out — valuation rises from below zero, but the composite is still neutral. This is often the base-building phase. Patience and staged entries can make sense.
Healthy advance — valuation positive and trending up, composite firmly Long. Pullbacks that keep valuation above zero are usually opportunities rather than trend breaks.
Late-cycle stretch — valuation pinned near the upper band while the composite starts to weaken toward neutral. Consider trimming, tightening risk, or shifting to a “let the market prove it” stance.
Distribution and unwind — valuation negative and falling, composite Short. Rallies are treated as counter-trend until both turn.
Settings that matter
Timeframe
This model is intended for 1D as the primary view. It can be inspected on higher or lower frames, but the design choices assume daily bars for crypto and other risk assets.
Asset-specific tuning
Inputs should be adjusted per asset. Coins with high variability benefit from longer lookbacks and slightly wider dynamic bands. Lower-volatility instruments can use shorter windows and tighter bands.
Valuation side
Lookback lengths — longer values make the oscillator steadier and more cycle-aware. Shorter values increase sensitivity but create more mid-zone noise.
Smoothing — enable to reduce flicker around zero and around the bands. Disable if you want faster warnings of regime change.
Dynamic vs fixed thresholds — dynamic bands float with recent dispersion and keep OB/OS comparable across regimes. Fixed bands are simple and make inter-asset comparison easy.
Scaling and re-expansion — keep this enabled if you want extremes to remain interpretable when volatility rises.
Trend side
Composite thresholds — widen the neutral zone if you want fewer flips. Tighten thresholds if you want earlier signals at the cost of more transitions.
Visibility — use the price-pane signal line and bar coloring to keep the regime in view while you focus on structure.
Alerts
Valuation OB/OS enter and exit — the oscillator entering or leaving stretched zones.
Zero-line crosses — valuation turning positive or negative.
Trend flips — composite crossing your long or short threshold.
Strengths
Separates “valuation context” from “trend state,” which improves decisions about when to add, reduce, or stand aside.
Composite voting reduces reliance on any single indicator family and improves robustness across regimes.
Volatility-aware scaling keeps signals interpretable during quiet and wild markets.
Clear, configurable visuals and alerts that support long-horizon discipline rather than frequent toggling.
Final thoughts
This is a universal long-term valuation strategy and trend model that aims to keep you aligned with the dominant regime while giving transparent context for stretch and risk. For crypto on 1D, it helps map accumulation, expansion, distribution, and unwind phases with a single, consistent language. Tune lookbacks, smoothing, and thresholds to the asset you trade, let the valuation side tell you where you are in the cycle, and let the composite trend side tell you what stance to hold until the market meaningfully changes.
Custom Portfolio [BackQuant] Custom Portfolio {BackQuant]
Overview
This script turns TradingView into a lightweight portfolio optimizer with institutional-grade analytics and real-time position management capabilities.
Rank up to 15 tickers every bar using a pair-wise relative-strength "league table" that compares each asset against all others through your choice of 12 technical indicators.
Auto-allocate 100% of capital to the single strongest asset and optionally apply dynamic leverage when the aggregate market is trending, with full position tracking and rebalancing logic.
Track performance against a custom buy-and-hold benchmark while watching a fully fledged stats dashboard update in real time, including 15 professional risk metrics.
How it works
Relative-strength engine – Each asset is compared against every other asset with a user-selectable indicator (default: 9/21 EMA cross). The system generates a complete comparison matrix where Asset A vs Asset B, Asset A vs Asset C, and so on, creating strength scores. The summed scores crown a weekly/daily/hourly "winner" that receives the full allocation.
Regime filter – A second indicator applied to TOTAL crypto-market cap (or any symbol you choose) classifies the environment as trending or mean-reverting . Leverage activates only in trending regimes, protecting capital during choppy or declining markets. Choose from indicators like Universal Trend Model, Relative Strength Overlay, Momentum Velocity, or Custom RSI for regime detection.
Capital & position logic – Equity grows linearly when flat and multiplicatively while invested. The system tracks entry prices, calculates returns including leverage adjustments, and handles position transitions seamlessly. Optional intra-trade leverage rebalancing keeps exposure in sync with market conditions, recalculating position sizes as regime conditions change.
Risk & performance analytics – Every confirmed bar records return, drawdown, VaR/CVaR, Sharpe, Sortino, alpha/beta vs your benchmark, gain-to-pain, Calmar, win-rate, Omega ratio, portfolio variance, skewness, and annualized statistics. All metrics render in a professional table for instant inspection with proper annualization based on your selected trading days (252 for traditional markets, 365 for crypto).
Key inputs
Backtest window – Hard-code a start date or let the script run from series' inception with full date range validation.
Asset list (15 slots) – Works with spot, futures, indices, even synthetic spreads (e.g., BYBIT:BTCUSDT.P). The script automatically cleans ticker symbols for display.
Indicator universe – Switch the comparative metric to DEMA, BBPCT, LSMAz adaptive scores, Volatility WMA, DEMA ATR, Median Supertrend, and more proprietary indicators.
With more always being added!
Leverage settings – Max leverage from 1x to any multiple, auto-rebalancing toggle, trend/reversion thresholds with precision controls.
Visual toggles – Show/hide equity curve, rolling drawdown heat-map, daily PnL spikes, position label, advanced metrics table, buy-and-hold comparison equity.
Risk-free rate input – Customize the risk-free rate for accurate Sharpe ratio calculations, supporting both percentage and decimal inputs.
On-chart visuals
Color-coded equity curve with "shadow" offset for depth perception that changes from green (profitable) to red (losing) based on recent performance momentum.
Rolling drawdown strip that fades from light to deep red as losses widen, with customizable maximum drawdown scaling for visual clarity.
Optional daily-return histogram line and zero reference for understanding day-to-day volatility patterns.
Bottom-center table prints the current winning ticker in real time with clean formatting.
Top-right metrics grid updates every bar with 15 key performance indicators formatted to three decimal places for precision.
Benchmark overlay showing buy-and-hold performance of your selected index (default: SPX) for relative performance comparison.
Typical workflow
Add the indicator on a blank chart (overlay off).
Populate ticker slots with the assets you actually trade from your broker's symbol list.
Pick your momentum or mean-reversion metric and a regime filter that matches your market hypothesis.
Set max leverage (1 = spot only) and decide if you want dynamic rebalancing.
Press the little " L " on the price axis to view the equity curve in log scale for better long-term visualization.
Enable the metrics table to monitor Sharpe, Sortino, and drawdown in real time.
Iterate through different asset combinations and indicator settings; compare performance vs buy-and-hold; refine until you find robust parameters.
Who is it for?
Systematic crypto traders looking for a one-click, cross-sectional rotation model with professional risk management.
Portfolio quants who need rapid prototyping without leaving TradingView or exporting to Python/R.
Swing traders wanting an at-a-glance health check of their multi-coin basket with instant position signals.
Fund managers requiring detailed performance attribution and risk metrics for client reporting.
Researchers backtesting momentum and mean-reversion strategies across multiple assets simultaneously.
Important notes & tips
Set Trading Days in a Year to 252 for traditional markets; 365 for 24/7 crypto to ensure accurate annualization.
CAGR and Sharpe assume the backtest start date you choose—short windows can inflate stats, so test across multiple market cycles.
Leverage is theoretical; always confirm your broker's margin rules and account for funding costs not modeled here.
The script is computationally heavy at 15 assets due to the N×N comparison matrix—reduce the list or lengthen the timeframe if you hit execution limits.
Best results often come from mixing assets with different volatility profiles rather than highly correlated instruments.
The regime filter symbol can be changed from CRYPTOCAP:TOTAL to any broad market index that represents your asset universe. Trading Module [BackQuant] Trading Module
Overview
Trading Module is a modular visual decision-support overlay designed to bring directional analysis, momentum timing, market structure, volatility context, reversal conditions, volume-informed zones and manually supplied options-positioning levels into one configurable workspace.
It is not built as a single automatic buy-and-sell system. Instead, it separates the trading process into several distinct questions:
What is the current directional bias?
Is the market producing a meaningful impulse or expansion event?
Where are the important structural levels and imbalances?
Is price entering an unusually extended or reversal-prone area?
Where could an existing trade idea become invalid?
Are externally calculated gamma-exposure levels creating additional context?
Each part can be enabled independently. A user may run only one trend model and one impulse model for a clean chart, or enable the broader structure, reversal, order-block, volumetric and GEX toolsets when more contextual information is required.
The script is intended for discretionary analysis. It provides organised information and repeatable visual states, but it does not remove the need for risk management, market knowledge or independent judgement.
Design philosophy
Markets do not present every part of a trade at the same time.
A market may have a clear bullish trend but no immediate momentum expansion. It may produce a strong impulse directly into resistance. It may appear statistically extended without having changed its larger structure. It may also break an internal pivot while its broader swing structure remains intact.
For that reason, this module keeps several analytical functions separate:
Trend defines the broader directional state.
Impulse highlights changes in pressure and expansion.
Market structure identifies confirmed continuation and shift events.
FVGs, order blocks and volumetric levels provide location.
Reversal bands identify unusually extended conditions.
Stop-loss references provide optional invalidation frameworks.
GEX levels add manually imported options-positioning context.
The purpose is not to force every component into agreement. It is to make disagreement visible.
For example:
A bullish trend with bullish impulse in open space is different from a bullish impulse directly into swing resistance.
A bearish internal structure break is different from a bearish break that also changes the swing structure.
A reversal-band signal is different when it appears with trend exhaustion than when it appears during a strong continuation move.
A technical breakout near a major supplied gamma level may require different expectations from the same breakout in an empty area.
This separation allows the user to build a process rather than rely on a single coloured line.
What makes the module distinct
Several familiar technical concepts are available as optional models, including moving-average, Hull, ATR, relative-strength and structure-based methods. Those individual concepts are not presented as new inventions.
The protected value of the module is in how the complete framework is assembled and managed:
Multiple selectable trend models with different response characteristics.
Protected composite models that combine several independent evidence families.
Separate impulse-state models rather than treating trend and timing as the same calculation.
Persistent state handling that avoids reducing every condition to a one-bar crossover.
A statistical reversal framework with layered volatility-adjusted zones.
Independent internal and swing market-structure engines.
Structure-linked order blocks with source-volume information, projected regions, midpoint references and tested-depth visualisation.
Persistent volumetric support and resistance zones.
Multi-timeframe fair value gaps with controlled chart retention.
A parser that converts compatible GEX text into organised chart levels and regime shading.
A shared visual language that allows these tools to be combined without loading a separate script for each task.
The module therefore does not depend on the novelty of any single classic indicator. Its purpose is to combine different forms of evidence into a consistent execution and analysis environment.
A practical workflow
A structured workflow may be:
Select a trend model to define the initial directional bias.
Use an impulse model to determine whether pressure is currently expanding or contracting.
Check internal and swing structure to identify whether price is continuing, transitioning or conflicting across scales.
Map nearby FVGs, order blocks and volumetric support or resistance.
Use the reversal bands to identify whether price is reaching an unusually extended area.
Add GEX levels when compatible and sufficiently current external data is available.
Choose an optional stop framework appropriate to the trade horizon.
The modules do not need to be enabled simultaneously. In many cases, a cleaner chart is preferable to displaying every available feature.
Trend models
The trend layer answers the question:
Which directional regime is currently dominant under the selected model?
Each model has a different balance between responsiveness, smoothness and confirmation. No model will be best in every market regime.
Universal Trend+
Universal Trend+ is a composite regime model.
Instead of depending on one crossover or one oscillator, it evaluates agreement across several different families of directional evidence. These include broader concepts such as:
Relative strength.
Momentum and rate of change.
Directional separation.
Smoothed trend state.
Volatility-adjusted structure.
The individual inputs are translated into comparable directional states before being combined into one persistent output.
This reduces dependence on a single type of calculation. A moving-average model may respond well in a smooth trend but struggle during compression. A momentum measure may react quickly but overstate temporary acceleration. A volatility-adjusted component may remain stable but respond later.
Universal Trend+ is designed to require broader directional agreement rather than treating any one family as sufficient by itself.
The plotted line acts as a visual carrier for the regime colour:
Bullish colour indicates positive composite alignment.
Bearish colour indicates negative composite alignment.
A neutral or unchanged state indicates that the model has not confirmed a new opposing regime.
The exact component thresholds, state transitions and internal aggregation remain protected.
EMA Cross
EMA Cross provides the most familiar baseline trend model.
It compares a faster exponential average with a slower exponential average:
Fast average above slow average indicates bullish bias.
Fast average below slow average indicates bearish bias.
This option is included because it is transparent, responsive and easy to interpret.
Its limitation is equally well known: moving-average crosses can change state repeatedly during sideways markets. It is therefore useful as a simple reference model or for users who prefer conventional trend logic, but it should not be treated as equivalent to the protected composite models.
DEMA ATR
DEMA ATR combines a reduced-lag trend estimate with a volatility-aware trailing mechanism.
The DEMA component attempts to respond more quickly than a conventional EMA of similar apparent smoothness. The volatility layer then prevents the trend state from reacting to every minor movement in the underlying estimate.
Conceptually:
The DEMA provides the adaptive directional centre.
The range component creates a movement threshold around that centre.
The resulting line trails in one direction until sufficient movement forces it to change.
This model is useful when a trader wants a single trend boundary that accounts for current range conditions.
Like all volatility trails, it involves a compromise:
Tighter behaviour reacts sooner but can produce more reversals.
Wider behaviour is more stable but confirms changes later.
Relative Strength Overlay
Relative Strength Overlay converts an internal strength reading into a persistent directional state.
It is not used as a conventional overbought or oversold oscillator. Instead, the model evaluates how the current strength condition is distributed across a range of internal reference levels.
The result is a broader strength score rather than a decision based on one fixed midline.
This model is useful when the desired question is:
Has directional strength shifted far enough to establish a new state?
The plotted trend line changes colour when the internal strength score confirms a bullish or bearish transition. The state can persist through smaller fluctuations until an opposing condition is established.
Hull Trend
Hull Trend uses the Hull Moving Average as a responsive directional filter.
The Hull method was designed to reduce some of the lag normally associated with moving-average smoothing. The model colours according to whether the Hull estimate is rising or falling.
This makes it one of the faster and more visually direct options in the module.
Its strengths are:
Smooth presentation.
Responsive slope changes.
Simple interpretation.
Its weakness is that local slope changes can occur frequently in ranging conditions. It is therefore most useful when combined with structure, impulse or location rather than treated as a complete system by itself.
Composite Trend Trader
Composite Trend Trader is the broadest and most computationally intensive trend model in the script.
It evaluates agreement across multiple independently processed families of market behaviour, including:
Smoothed trend and momentum.
Adaptive historical distributions.
Relative displacement.
Deviation and persistence.
Filtered rate-of-change behaviour.
Directional threshold states.
Different components are normalised or converted into comparable directional assessments before being combined into a final persistent regime.
The purpose is to prevent one short-lived reading from controlling the entire model. A new state requires sufficient agreement across the internal framework.
This option can be useful when the user prefers a more selective composite view, but it will generally be heavier than the simpler models and may react later than a direct moving-average or Hull calculation.
The precise transformations, adaptive thresholds, component weights and confirmation rules remain protected.
Choosing a trend model
The models should not be judged only by how early they change colour.
Earlier models often produce more false transitions. Slower models often remain stable but surrender more of the initial move.
A practical selection guide is:
EMA Cross: conventional and transparent.
Hull Trend: smooth and responsive.
DEMA ATR: volatility-aware trailing structure.
Relative Strength Overlay: persistent strength-based regime.
Universal Trend+: moderate composite confirmation.
Composite Trend Trader: broader and more selective composite state.
The appropriate choice depends on timeframe, market behaviour and how the user intends to combine it with the other modules.
Impulse models
Trend and impulse are deliberately separated.
Trend describes the current directional regime. Impulse identifies a change in pressure, expansion or initiative activity.
A market can remain bullish while its positive impulse has already faded. It can also produce a sharp positive impulse inside a larger bearish regime.
The impulse markers use two states:
L represents a positive or long-side impulse condition.
C represents a defensive or cash-state transition.
The C marker should not automatically be interpreted as a short entry. It indicates that the prior positive impulse state has deteriorated under the selected model.
BBPct FL Impulse
BBPct FL Impulse evaluates where price sits within a volatility-adjusted distribution and then compares the resulting pressure state with its own recent history.
The model is designed to distinguish between:
Ordinary movement inside the prevailing distribution.
Sustained pressure toward one side of the distribution.
A meaningful deterioration from an established positive impulse.
Rather than firing on every band interaction, the internal state requires a broader persistence or ranking condition to be met.
A positive marker can therefore be read as a transition into stronger upside pressure. A cash marker indicates that this pressure state has weakened sufficiently to exit its prior condition.
This model is usually most useful when interpreted beside the selected trend model:
Positive impulse with bullish trend supports directional alignment.
Positive impulse with bearish trend may represent a squeeze or counter-trend event.
A cash transition during a bullish trend may represent slowing momentum rather than a confirmed bearish reversal.
DM Impulse Enhanced
DM Impulse Enhanced is based on directional-movement behaviour processed through a comparative persistence framework.
It is designed to identify periods where directional expansion becomes meaningfully stronger relative to its recent behaviour, rather than relying only on an isolated directional-movement reading.
The model is useful for detecting:
Initiation of directional pressure.
Renewed momentum inside an existing trend.
Failure of an established impulse state.
As with the other impulse option, it should be used as timing context rather than a complete trade signal.
Using trend and impulse together
The most direct combinations are:
Bullish trend + positive impulse: directional alignment.
Bullish trend + cash transition: bullish regime remains, but immediate expansion has weakened.
Bearish trend + positive impulse: possible counter-trend squeeze or early transition.
Trend change without impulse: directional model has shifted, but immediate pressure confirmation is absent.
No combination guarantees continuation. The purpose is to show whether direction and timing are aligned.
Stop-loss reference methods
The stop-loss layer provides optional visual risk references.
These plots are not position-sizing tools and should not be treated as universal stop placements. A valid stop still depends on trade thesis, liquidity, timeframe, instrument behaviour and acceptable risk.
Dynamic
Dynamic mode plots a volatility-responsive upper and lower range around price.
The width expands when recent true range increases and contracts when conditions become quieter.
This can be useful for:
Allowing more room during volatile expansion.
Avoiding a fixed-distance stop across different regimes.
Visualising whether a proposed stop is unusually tight relative to recent movement.
The bands should be treated as environmental references rather than automatic orders.
Fixed
Fixed mode displays several preset percentage offsets around the current reference price.
These can be used for:
Planning risk units.
Comparing potential stop distances.
Visualising scaling or invalidation bands.
Maintaining consistent journalling rules.
A fixed percentage does not adapt to volatility. The same percentage may be excessive in a quiet instrument and too narrow in a highly volatile instrument.
Bar-to-Bar
Bar-to-Bar mode uses the prior candle’s relevant boundary as a short-horizon invalidation reference.
This is the tightest and most tactical option.
It may be appropriate for:
Very short-duration trades.
Immediate post-breakout management.
Entries where the previous bar defines the thesis.
It is also highly sensitive to ordinary candle noise and can result in frequent invalidation.
Reversal Bands
The Reversal Bands are a separate statistical extension model designed to highlight areas where price has moved unusually far from its prevailing baseline.
They are not conventional fixed envelopes and are not intended to predict the exact high or low of a move.
The framework combines two broad forms of evidence:
The current price extreme relative to its historical distribution.
The current displacement relative to a volatility-adjusted baseline.
A reversal signal requires both location and displacement conditions to align.
This is important because either condition alone may be insufficient:
A historically unusual low does not necessarily mean price is far from its current trend.
A large deviation from a baseline does not necessarily mean the current low or high is statistically unusual.
By requiring agreement between the two, the model attempts to identify more meaningful extension events.
Band structure
The central upper and lower reversal boundaries mark the initial statistical extension area.
Additional outer layers are plotted beyond these boundaries to show progressively deeper displacement.
The gradient is designed to communicate degree rather than create several unrelated signals:
The inner edge represents the first reversal-band threshold.
The outer layers represent increasingly extended conditions.
Price moving deeper into the gradient indicates greater deviation, not a guaranteed immediate reversal.
Dip and top markers
The optional markers identify bars where the protected reversal conditions are simultaneously satisfied.
A bullish marker identifies a lower-side extension event.
A bearish marker identifies an upper-side extension event.
These markers are best interpreted as areas requiring attention.
They may indicate:
Potential exhaustion.
A local mean-reversion opportunity.
A period where continuation risk is becoming less favourable.
The beginning of a consolidation rather than an immediate reversal.
They should not be treated as instructions to trade directly against a strong trend.
Using reversal bands with trend
The reversal framework becomes more informative when read beside the trend model.
Examples:
A lower-band signal inside a bullish trend may identify a pullback or local exhaustion event.
An upper-band signal inside a bearish trend may identify a counter-trend rally reaching an extended area.
Repeated upper signals during a strong bullish trend may show persistent expansion rather than an immediately tradable top.
A reversal signal accompanied by an opposing structure break carries different information from a signal with no structural change.
The bands measure extension. The trend and structure modules help determine whether that extension is being accepted, rejected or continued.
Market structure
The market-structure engine provides two independently configurable layers:
Internal structure for shorter-horizon pivots and local changes.
Swing structure for broader pivots and higher-level market organisation.
Each layer maintains its own active highs, lows and directional bias.
This prevents a local internal break from automatically being treated as a complete swing reversal.
Pivot confirmation
Structure is based on confirmed pivot points.
A pivot requires surrounding price information before it can be established. This means the turning bar is recognised only after the selected pivot depth has elapsed.
This is a necessary limitation of confirmed swing analysis:
Lower pivot depths respond sooner but create more local structure.
Higher pivot depths identify broader swings but confirm later.
The pivot should not be interpreted as having been known in real time on the original turning bar.
BOS and MSB
The module classifies confirmed structure breaks as:
BOS — Break of Structure: a break continuing in the currently established directional bias.
MSB — Market Structure Break: a break occurring against the established bias.
The first valid break establishes the initial bias and is treated as a continuation-type event.
This classification provides more context than labelling every pivot break identically.
For example:
A bullish BOS during a bullish swing regime confirms continuation.
A bearish internal MSB may warn that short-term structure is weakening.
A bearish swing MSB represents a broader structural change than an internal event alone.
Break confirmation
The user can choose whether structure breaks are confirmed by:
A completed candle close through the level.
A completed candle wick through the level.
Close confirmation is generally more selective.
Wick confirmation reacts earlier but will include more temporary penetrations and liquidity sweeps.
Internal and swing structure may also use different line styles, making the two scales visually distinct.
Fair Value Gaps
The Fair Value Gap module identifies three-candle imbalance regions where price moves strongly enough to leave an untraded interval between the first and third bars.
The user can choose:
Bullish gaps.
Bearish gaps.
Both directions.
The chart timeframe or another timeframe.
How many zones to retain.
How far zones should extend.
FVGs are displayed as areas rather than single levels because the imbalance occupies a price range.
They may be used to study:
Potential rebalancing areas.
Retracement locations after displacement.
Continuation zones.
Areas where price previously moved with limited two-way trade.
A fair value gap is not guaranteed support or resistance. Some gaps are filled immediately, some remain open for long periods, and some are crossed without reaction.
The module removes a zone after its defined fill condition has been met.
Volume-informed order blocks
The order-block engine is linked to the internal and swing structure systems.
Active zones can be created from:
Internal BOS events.
Internal MSB events.
Swing BOS events.
Swing MSB events.
The user can select which structure layer and event type should be allowed to create zones.
The engine identifies a source region associated with the movement leading into a confirmed structure break. That region is then stored and managed as an active bullish or bearish block.
The exact candidate-selection process remains protected, but the resulting zone contains:
An upper and lower boundary.
A midpoint reference.
The originating time.
The volume associated with the selected source candle.
A persistent record of how deeply price has tested the zone.
Internal and swing blocks
Internal and swing blocks are displayed separately.
Internal blocks represent shorter-horizon structure and use a lighter visual treatment.
Swing blocks represent broader structure and use a stronger midpoint and border treatment.
This allows the user to distinguish between:
Local execution zones.
Broader structural zones.
A local block inside a larger swing block may provide a more precise entry area, but the larger zone generally represents the broader context.
Source volume and visible share
When enabled, each projected block displays:
The source volume associated with that block.
Its percentage share of the currently visible volume within the same structural channel.
This is a relative comparison between displayed zones. It is not presented as an estimated buy-versus-sell split.
A higher share means the source candle contributed more volume relative to the other visible blocks in that channel. It does not guarantee that the zone will hold.
Tested-depth shading
The order-block engine records the deepest confirmed interaction with each active zone.
The tested portion is shaded separately from the untested portion.
This provides a direct visual representation of:
How much of the block has already been traded into.
How much of the original zone remains untested.
Whether repeated interactions are gradually consuming the area.
This is a measure of interaction depth, not a prediction that an untouched section must produce a reaction.
Midpoint and projection
Each block contains a midpoint reference.
The midpoint style differs between internal and swing zones so their structural scale remains identifiable.
Active zones are projected forward by a configurable number of bars. The projected region can be used to study:
Future retests.
Potential invalidation areas.
Liquidity interaction.
Possible target or reaction context.
Projection does not imply that price must return to the zone.
Mitigation methods
The user can choose between two mitigation rules:
Wick mitigation uses the outer block boundary.
Midpoint mitigation uses the centre of the block.
Midpoint mitigation removes a zone sooner because a deeper test is not required.
Wick mitigation allows the block to remain active until its full outer boundary has been exceeded.
The correct choice depends on how strictly the user defines invalidation.
Volumetric support and resistance
The volumetric support and resistance module identifies pivot-based zones that also satisfy a relative-volume requirement.
Rather than drawing every pivot, it attempts to retain levels associated with more meaningful volume conditions.
The system includes controls for:
Pivot sensitivity.
Minimum relative-volume requirement.
Analysis window.
Maximum number of active levels.
Minimum spacing between nearby zones.
Removal after confirmed breaks.
Optional forward extension.
The output is displayed as a zone with ATR-scaled thickness rather than a single exact line.
This reflects the practical reality that support and resistance normally operate across an area.
Higher-volume events receive stronger visual emphasis.
The levels can be used for:
Locating potential reaction areas.
Planning targets.
Identifying whether an impulse is entering open space or established structure.
Comparing technical trend signals with volume-supported locations.
They are historical reference zones, not guaranteed barriers.
Gamma Exposure Levels
The GEX section converts a compatible text report into horizontal levels and optional regime shading.
It is important to understand what this module does and does not do:
It does not connect directly to an options exchange.
It does not download options data.
It does not independently calculate gamma exposure.
It plots and organises values supplied by the user through the text input.
The accuracy and usefulness of the output therefore depend entirely on the quality, compatibility and freshness of the pasted data.
Supported level families
The parser can display several categories when they are present in the supplied text.
All-expiry levels
High Volume Level.
Call-side resistance.
Put-side support.
These provide broader options-positioning context across the included expirations.
0DTE levels
0DTE High Volume Level.
0DTE call level.
0DTE put level.
These focus on same-day positioning and may be more relevant to intraday conditions.
Because 0DTE positioning can change quickly, stale input can become misleading.
Advanced levels
The module can also display:
Max Pain.
Expected Move upper and lower boundaries.
Multiple gamma flip zones.
These levels require careful interpretation.
A binary background on either side of Zero Gamma.
A gradient whose intensity increases with distance from Zero Gamma.
Max Pain
Max Pain is the supplied strike where aggregate option-holder value is estimated to be minimised at expiration.
It should not be treated as a forecast or as a level price must reach. Its relevance can vary significantly with time to expiration, positioning changes and market movement.
Expected Move
The expected-move levels display the supplied upper and lower range.
They provide a reference for the magnitude of movement implied by the input data. They do not define hard support or resistance.
Flip zones
Flip zones identify supplied prices where gamma polarity changes.
Several zones may exist. Their importance may differ depending on the size and composition of the underlying positioning.
GEX Top 10
The user can optionally display ranked GEX strikes from:
0DTE data.
All-expiry data.
The first five levels only.
The complete available top-ten set.
Each rank can be enabled or disabled and assigned its own colour.
The parser uses the ranking included in the supplied report. It does not recalculate the ranking from raw options data.
Overlapping levels
Several GEX concepts may resolve to the same or nearly the same price.
Instead of plotting several unreadable labels on top of one another, the script combines nearby values into one level label.
For example, one price may simultaneously represent:
A call level.
A high-volume level.
A max-pain level.
Combining these labels makes confluence visible without adding unnecessary chart clutter.
Using GEX with the technical modules
GEX levels are most useful as context rather than standalone signals.
Examples:
A bullish impulse approaching a major call-side level is different from the same impulse with no nearby supplied resistance.
A reversal-band signal near an expected-move boundary may deserve greater attention than one near the middle of the supplied range.
A structure break occurring below a supplied Zero Gamma level may behave differently from one occurring in a positive-gamma regime.
An order block overlapping several supplied options levels creates a visible area of multi-method confluence.
Because the GEX data is external and manually entered, it should be refreshed whenever the underlying report changes.
Suggested configurations
1. Clean trend-following mode
Select one trend model.
Enable one impulse model.
Use Dynamic stop references if required.
Disable structure, gaps, blocks, volumetric levels and GEX.
This produces the lightest and cleanest presentation.
2. Structure and execution mode
Select a trend model.
Enable internal and swing structure.
Show BOS and MSB events.
Enable internal and swing order blocks.
Display tested depth and source volume.
Add FVGs and volumetric levels selectively.
This configuration focuses on directional context and execution location.
3. Reversal and exhaustion mode
Select a slower trend model.
Enable reversal bands and markers.
Display internal structure.
Use FVGs or volumetric zones for location.
This helps distinguish a statistical extension from an actual structural reversal.
4. GEX context mode
Paste a current compatible GEX report.
Display only the most relevant level families.
Use a simple trend model to avoid clutter.
Add Zero Gamma shading if required.
Compare options levels with order blocks, FVGs or reversal bands.
5. Minimal price-action mode
Disable trend and impulse models.
Use swing and internal structure.
Enable selected order-block channels.
Display only a small number of FVGs and volumetric zones.
This allows the script to function primarily as a structure and location toolkit.
Performance considerations
This is a large modular script.
The trend and stop components are relatively light, while the following features require more processing or drawing resources:
Composite Trend Trader.
Multiple structure layers.
Large pivot depths.
Numerous order blocks.
Tested-depth rendering.
Multi-timeframe FVGs.
Large numbers of volumetric zones.
Many imported GEX levels and labels.
Users should enable only the modules needed for the current workflow.
Displaying every feature simultaneously may:
Increase execution time.
Create visual clutter.
Make the important information harder to interpret.
Approach TradingView drawing or processing limits on some configurations.
Summary
Trading Module is designed as a configurable analytical framework rather than a single black-box signal.
Its trend models establish directional state. Its impulse models identify changes in pressure. Its structure engine separates internal and swing continuation from potential regime shifts. Its FVG, order-block and volumetric modules provide location. Its reversal bands identify statistical extension. Its stop overlays provide optional risk references. Its GEX parser adds manually supplied options-positioning levels without pretending to calculate or source that data internally.
The intended use is confluence with clear separation of roles:
Trend provides bias.
Impulse provides timing context.
Structure provides confirmation.
Zones provide location.
Reversal bands provide extension context.
GEX provides an additional external positioning layer.
Stops provide risk-reference frameworks.
No individual component should be assumed to predict future price. The module is most useful when its different layers are used to build a consistent, testable and risk-aware decision process.